FIGURE 2.
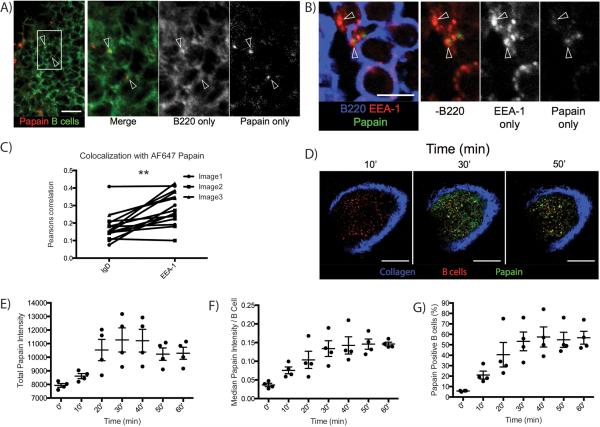
Confocal and intravital microscopy reveal that PLN B cells rapidly acquire and subsequently internalize papain after footpad immunization. (A) Confocal microscopy indicating colocalization of B cells and AF647-labeled papain at 24 h post-immunization. Green indicates B220, red indicates AF647-labeled papain. Arrows indicate points of colocalization between B220 and AF647-papain. White bar indicates 14 μm. (B) Confocal microscopy showing colocalization of AF647-papain and the early endosomal marker EEA-1 in B cells 24 h post-immunization. Blue indicates B220, green indicates AF647-papain, and red indicates EEA-1. Arrows indicate colocalization between EEA-1 and AF647-papain on B220+ B cells, and white bar indicates 5 μm. (C) A comparison of the Pearson correlation coefficients between AF647-labeled papain and the B cell surface marker IgD versus the early endosomal marker EEA-1. Dots indicate individual replicates and lines indicate paired observations from the same image. ** indicates p<0.01. (D) Representative images at a depth of 30 μm taken from a time course of AF647 uptake by adoptively transferred CD21-cre_tdTomato B cells in PLN of C57BL/6 mice captured at the indicated time points. AF488-papain was injected into the footpad and the PLNs were live-imaged using intravital-multiphoton microscopy. Blue indicates collagen, green indicates papain, and red indicates B cells. White bar indicates 100 μm. (E) Time course of total papain intensity in the PLN expressed as median of 4 depths captured as described in (D). Line and error bars indicate mean ± SD, ANOVA p<0.001. (F) Time course of median papain intensity of CD21-cre_tdTomato cells from the images in (D). Line and error bars indicate mean ± SD, ANOVA p<0.0005. (G) Time course indicating the percentage of CD21+ cells identified as described in (F) positive for papain. Line and error bars indicate mean ± SD, ANOVA p<0.0005.

