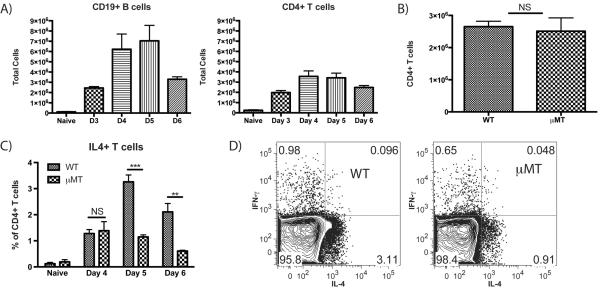
FIGURE 3.
B cell deficient μMT mice show no difference in papain-induced T cell expansion but have a marked reduction in CD4+ T cell IL-4 production. (A) Total number of CD19+ B cells and CD4+ T cells in the PLN from naïve mice or papain immunized WT mice 3–6 d post-immunization. Bars indicate mean ± SD from 2–3 independent experiments per time point with n=3 mice per group per experiment. (B) Comparison of CD4+ T cell numbers in the PLN at d 5 following papain immunization in WT and μMT mice. Bars indicate mean ± SD from 3 independent experiments with n=3 mice per group. (C) Time course showing the percentage of IL-4 expressing PLN CD4+ T cells from naive and papain-injected WT and μMT mice at d 4–6 following papain immunization. Bars indicate mean ± SD from 2–4 independent experiments per time point with n=3–4 mice per group per experiment, NS indicates no significant difference, ** indicates p<0.01, *** indicates p<0.001. (D) Representative plots showing the percentages of IL-4 and IFN-γ expressing CD4+ T cells from WT and μMT mice 5 d after papain immunization.

