

We thank Bazazi and colleagues1 for their interest in our article and the opportunity to provide clarification regarding the 1) limitations of respondent-driven sampling (RDS) generally, and specifically for network analyses and 2) challenges of integrating network and spatial analytic approaches.
First, Bazazi and colleagues raise concern regarding the representativeness of the sampled network, the types of ties observed, and selection bias1. These problems are not unique to RDS data; a potential for unmeasured ties and selection bias exists in all network studies. Further, the authors do not claim that RDS is free of selection bias and have previously acknowledged (using the same data) that many RDS assumptions are not met in practice.3,4 In addition to recruiter-recruit ties, we collected ego-centric network data using name generators (e.g., support and drug/sex network members) and characteristics about each person named.2 While we had hoped to create a quasisociometric network by combining recruiter-recruit ties with ties confirmed by matching names in the personal network inventories, our IRB prohibited us from retaining names on egocentric network members. Future studies would benefit from collecting additional information on recruiter-recruit relationships, particularly drug/sex behaviors between ties which are most likely to transmit HIV.
Bazazi et al. also question the relevance of our outcome and propose HIV infection as a more intuitive outcome.1 Health-related network research can be used both to assess disease patterns and to understand how network relationships promote and/or prohibit disease transmission. As stated in our paper, the median time since first HIV diagnosis was 10 years.5 Consequently, examining current network and spatial factors associated with HIV would be inappropriate, as participants' current network and environment may not be similar to those at the time he/she acquired HIV. In our sample, HIV positive participants reported a mean of 5 different sex partners (past 2 months). Of 85 HIV positive individuals reporting sex with ≥1 partner (past 2 months), only 9 (10.6%) reported always using a condom. This consequently places their sexual partners at increased risk for HIV. While we are unable to discern whether or not individuals in the same recruitment chain have sex with one another or which ties represent sexual ties, we found that individuals in high HIV prevalence recruitment chains also reported higher risk drug/sex behaviors, which may facilitate disease transmission to those not currently infected. R0 depends on the contact rate, infectiousness of disease, and duration of infectivity. Due to the increased prevalence of HIV and high-risk sex behaviors among individuals in higher HIV prevalence recruitment chains which were defined by drug use ties, members without HIV are at an increased risk for acquiring HIV. Our report provides plausible evidence that HIV acquisition is more likely among those in higher HIV prevalence recruitment chains (or similar network members not sampled) than it is among those in lower HIV prevalence recruitment chains with fewer high-risk sexual behaviors.
We offered the following explanations for the “reach of HIV” and do not suggest that one is preferred: 1) because HIV is infectious, it's “reach” is likely greater, particularly among networks connected by drug use and in most instances drug/sex behaviors that directly facilitate transmission, 2) recruitment homophily by HIV status or other high-risk behaviors associated with HIV transmission, 3) limitations resulting from using RDS data (e.g., missing links, overestimation of several-degree links).5 Further, the use of a statistical test in addition to a visual inspection is appropriate and necessary before claiming that HIV is not randomly distributed within recruitment chains.
Even with these limitations, the RDS network ties examined here represent actual recruitment linkages, similar to those that would be generated with a network-driven intervention. While not all network members are equally likely to be recruited, the goal for HIV prevention and care is to find individuals who need these services. Our findings demonstrate the feasibility of reaching HIV positive and HIV-at-risk non-injection drug users (NIDUs) using a network-driven approach (such as RDS). They additionally provide insight regarding the development of interventions that combine targeted and network-driven approaches to increase 1) HIV care uptake and treatment adherence among HIV positive NIDUs, and 2) HIV testing among at-risk HIV negative NIDUs.
Finally, Bazazi and colleagues suggest that the observed network clustering may reflect 1) spatial proximity among individuals in the same recruitment chain and 2) spatial clustering of HIV in the Bronx1. As seen in Figure 1, RDS recruitment chains were not geographically confined. Rather, participants frequently recruited others in different boroughs. To assess geographic clustering for HIV positives and HIV negatives, we estimated the K function for each using the SPLANCS software package in R6. The S shape of the K functions (not shown here) and the images in Figure 2 demonstrate that both HIV positive and negative individuals are more spatially clustered than expected (assuming complete spatial randomness). To evaluate the extent of clustering for HIV positives compared with HIV negatives, we tested the null hypothesis, KHIVpositives(h)=KHIVnegatives(h), by calculating the difference in the K functions for a range of distances, h. 1,000 Monte Carlo simulations were used to generate confidence envelopes for the difference in K functions based on randomly permuting disease status location labels to provide the corresponding distribution under the null hypothesis.7 While HIV positives were more spatially clustered than HIV negatives, the difference was not statistically significant over the distance considered (Figure 3).
Figure 1.
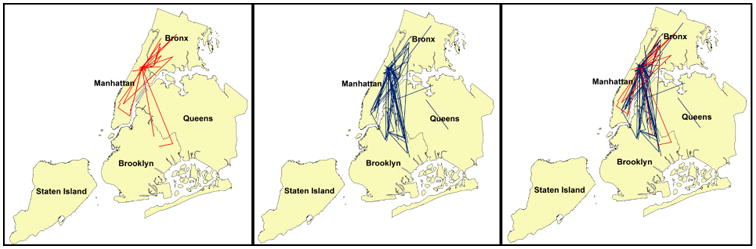
Recruitment linkages for RDS recruitment chains with >10.54% HIV prevalence are represented by red lines and recruitment linkages for RDS recruitment chains with <10.54% HIV prevalence are represented with blue lines. There is extensive cross-borough recruitment observed in this sample. For example, of the recruitment ties with at least one participant in the Bronx, 79% of those in RDS recruitment chains with >10.54% HIV prevalence were cross-borough, compared with 63% of the recruitment ties in RDS recruitment chains with <10.54% HIV.
Figure 2. A) Spatial intensity of HIV positive RDS participants and B) Spatial intensity of HIV negative RDS participants.

Figure 3.

Difference between K functions for HIV positives and HIV negatives (solid black line) and 100% confidence envelopes (dotted red lines), based on 1000 Monte Carlo simulations, New York City, New York (2006-2009). Confidence envelopes represent the set of confidence intervals over the range of spatial distances examined. The lowest and highest ranking observations for the difference in K functions at each distance represent 100 percent confidence envelopes in which to assess significant differences in geographic clustering between the HIV positive and negative individuals. At distances where the difference in K functions exceeds the 100% confidence envelopes, differential spatial clustering is observed. While HIV positive individuals are more spatially clustered than HIV negative individuals (positive value for the K function difference), the difference falls within the 100% confidence bounds and is therefore not significantly different from what we would expect by chance for individuals separated by 0-3,000 meters. One mile = 1.609 km.
We thank Bazazi and colleagues for the opportunity to engage in a discussion relevant for researchers interested in applying methods from social network analysis to RDS data. Although RDS network data has its limitations, they do not negate our use of this approach to examine risk behaviors among RDS network members, as this type of analysis can provide a better understanding of disease transmission. Being able to connect ego-centric network data with RDS recruiter-recruit ties (including the type of risk shared between them) would have improved this analysis and warrants investigation. Finally, we hope this exchange will encourage others to explore novel ways of combining network and spatial analytic approaches.
Acknowledgments
This work was supported by the National Institute on Drug Abuse at the National Institutes of Health grant numbers K01 DA033879 and R01 DA019964.
Abbreviations
- CI
Confidence Interval
- HIV
Human Immunodeficiency Virus
- NIDU
Non-injection Drug User
- RDS
Respondent-Driven Sampling
References
- 1.Bazazi A, Zelenev A, Altice FL. Letter to the Editor: Regarding Individual and neighborhood correlates of membership in drug using networks with a higher prevalence of HIV in New York City (2006-2009) Annals of Epidemiology. 2013 doi: 10.1016/j.annepidem.2013.07.018. [DOI] [PMC free article] [PubMed] [Google Scholar]
- 2.Rudolph AE, Latkin C, Crawford ND, Jones KC, Fuller CM. Does respondent driven sampling alter the social network composition and health-seeking behaviors of illicit drug users followed prospectively? PLoS One. 2011;6(5):e19615. doi: 10.1371/journal.pone.0019615. [DOI] [PMC free article] [PubMed] [Google Scholar]
- 3.Rudolph AE, Crawford ND, Latkin C, Heimer R, Benjamin EO, Jones KC, Fuller CM. Subpopulations of illicit drug users reached by targeted street outreach and respondent-driven sampling strategies: implications for research and public health practice. Ann Epidemiol. 2011;21(4):280–9. doi: 10.1016/j.annepidem.2010.11.007. [DOI] [PMC free article] [PubMed] [Google Scholar]
- 4.Rudolph AE, Fuller CM, Latkin C. The importance of measuring and accounting for potential biases in respondent-driven samples. AIDS Behav. 17(6):2244–52. doi: 10.1007/s10461-013-0451-y. [DOI] [PMC free article] [PubMed] [Google Scholar]
- 5.Rudolph AE, Crawford ND, Latkin C, Fowler JH, Fuller CM. Individual and neighborhood correlates of membership in drug using networks with a higher prevalence of HIV in New York City 2006-2009. Annals of epidemiology. 2013 doi: 10.1016/j.annepidem.2013.02.006. [DOI] [PMC free article] [PubMed] [Google Scholar]
- 6.R Development Core Team. R: A language and environment for statistical computing. Vienna, Austria: R Foundation for Statistical Computing; 2008. [Google Scholar]
- 7.Ripley B. Modeling spatial patterns (with discussion) Journal of the Royal Statistical Society. 1977;39:172–212. [Google Scholar]