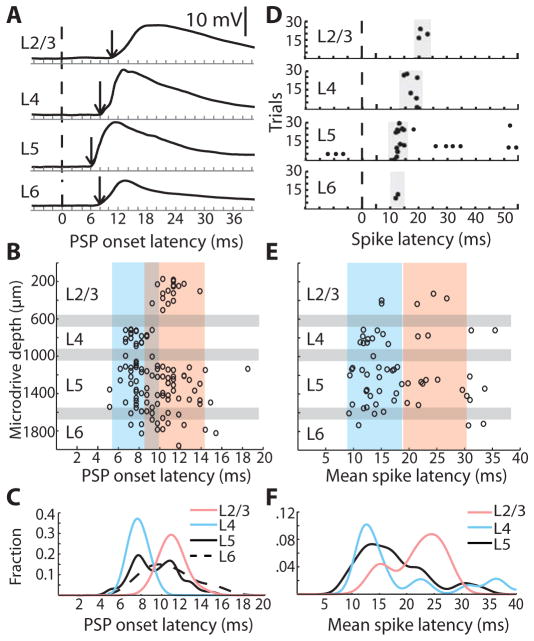
Fig. 1. Many L5/6 cells have response latencies as short as L4.
(A) Example whole-cell traces from histologically identified cells. Dashed line, time of whisker deflection; arrow, PSP onset. (B) PSP onset latencies by microdrive depth (n = 126). Gray bars, approximate laminar boundaries correspond to the microdrive depths where histologically recovered neurons were found in each layer. Blue and pink boxes, approximate extent of the densities of L4 and L2/3 data, respectively, as in panel C. (C) Normalized probability densities of PSP onset latencies. (D) Example raster plots of cells in each layer relative to whisker deflection. (E) Distribution of mean spike latencies for responsive cells (n = 64) by microdrive depth. (F) Normalized probability densities of mean spike latencies. L6 density was not calculated due to insufficient spiking.

