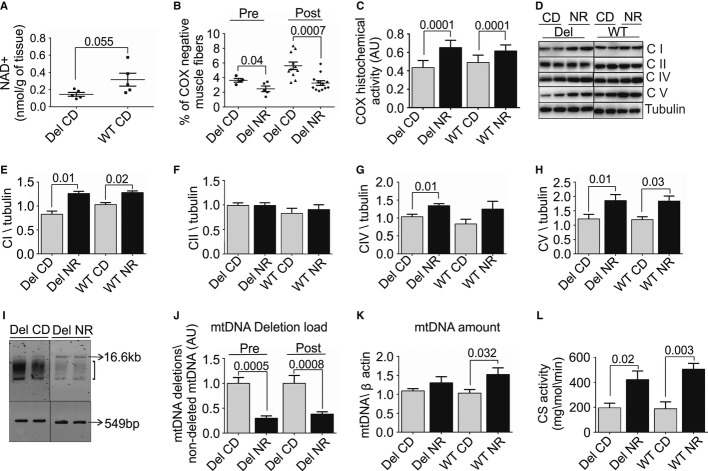
Figure 1. Nicotinamide riboside (NR) induces mitochondrial biogenesis and effectively ameliorates morphological and genetic landmarks of mitochondrial myopathy.
- A Skeletal muscle NAD+ content in 23- to 27-month-old Deletors and WT mice (n = 5 in each group).
- B Quantification of muscle fibers showing decreased COX activity in histochemical analysis of frozen sections of quadriceps femoris muscle (total fibers n = 2000 counted per mouse); diet started before disease manifestation (pre-manifestation, “pre”; Deletor NR n = 5; Deletor CD n = 4); diet started after disease manifestation (post-manifestation, “post”; Deletor NR n = 12; CD n = 11).
- C Quantification of the overall histochemical COX activity in muscle. Total intensity of activity in the quadriceps femoris muscle measured (n = 6 in each group).
- D Mitochondrial respiratory complex protein and ATPase protein amounts in quadriceps femoris muscle. Western blot analysis of post-manifestation NR- and CD-fed mouse groups. Representative results shown. CI, respiratory chain complex I, 39-kDa subunit; CII, complex II, 70-kDa subunit; CIV, complex IV, cytochrome c oxidase, COI subunit, 40 kDa; CV, complex V, ATPase, alpha subunit, 55 kDa. Tubulin indicates the loading control.
- E–H Quantification of the respiratory chain complex amounts from Western blots (Fig 1D). (Deletor NR n = 8; Deletor CD n = 8, WT NR n = 6, WT CD n = 6).
- I Multiple mtDNA deletions in quadriceps femoris muscle. Long-range PCR amplification. 16.6 kb: amplification product from full-length mtDNA; bracket: smear representing deleted mtDNA species; 549 bp, product from 12S rRNA gene in mtDNA, not carrying deletions and representing total mtDNA. Representative image (pre-treatment Deletor NR n = 5; Deletor CD n = 4; post-manifestation Deletor NR n = 12; Deletor CD n = 11).
- J Quantification of mtDNA deletion load (H). Pre- and post-manifestation NR- and CD (pre-manifestation; Deletor NR n = 5; Deletor CD n = 4), (post-manifestation; Deletor NR n = 12; CD n = 11).
- K mtDNA copy number in quadriceps femoris muscle. Quantitative PCR analysis, using beta-actin gene as a nuclear two-copy control gene (post-manifestation Deletor NR n = 12; Deletor CD n = 11, WT NR n = 8, WT CD n = 7).
- L Citrate synthase (CS) activity in quadriceps femoris muscle (n = 5 in each group). Numbers above columns indicate P-values. All values are presented as mean ± s.e.m. (Student's t-test).
NR, nicotinamide riboside; CD, chow diet; Del, Deletor; WT, wild-type mice; pre, pre-manifestation age group; post, post-manifestation age group; COX, cytochrome c oxidase; CI-CIV respiratory chain complexes I-IV; CV, ATP synthase; AU, arbitrary units.
Source data are available for this figure.

