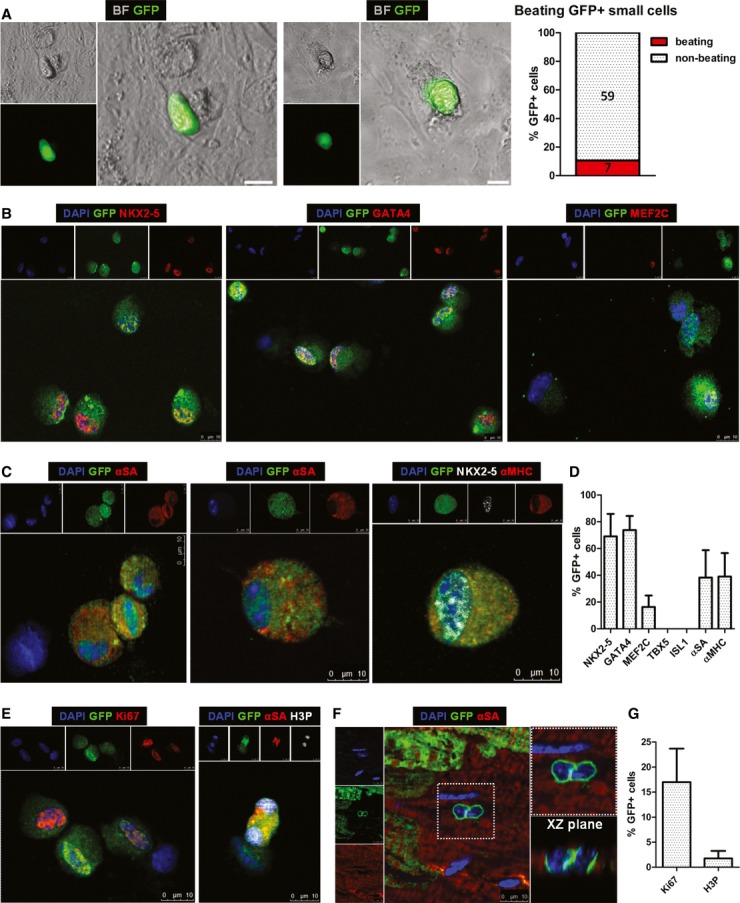
Still images of GFP+ cardioblasts exhibiting spontaneous contractile activity in vitro after 1 day in culture (see Supplementary Movies S1 and S2 for the corresponding Movies) (scale bars, 10 μm) [green: GFP, bright field (BF)].
Fluorescent immunocytochemistry of FACS-sorted GFP+ cardioblasts for nuclear expression of cardiac transcription factors NKX2-5, GATA4, and MEF2C. Note that GFP− cells (middle & right panels, resulting from imperfect FACS for GFP) are negative for cardiac transcription factors (blue: DAPI, green: GFP, red: NKX2-5, GATA4, MEF2C).
Fluorescent immunocytochemistry of FACS-sorted GFP+ cardioblasts for cytoplasmic expression of α-sarcomeric actinin (αSA) and α-myosin heavy chain (αMHC). Image on the right shows a GFP+ cardioblast expressing αMHC in the cytoplasm and NKX2-5 in the nucleus. Note that GFP− cells (left panel) do not express sarcomeric proteins (blue: DAPI, green: GFP, red: αSA/αMHC).
Quantification of expression of cardiac transcription factors and sarcomeric proteins in GFP+ cardioblasts by fluorescent immunocytochemistry (n = 4 mice). No expression of TBX5 or ISL1 could be detected in GFP+ cells.
Fluorescent immunocytochemistry of FACS-sorted GFP+ cardioblasts for Ki67 and phosphorylated histone H3 (H3P). Note that the GFP− cell is Ki67− (left panel) and the GFP+ dividing cardioblast is expressing H3P in both nuclei (right panel) (blue: DAPI, green: GFP, red: Ki67/αSA, white: H3P).
Confocal microscopy revealed the presence of GFP+ cardioblasts appearing to undergo mitosis in the border zone. Image on the right is a magnified image of highlighted area on left. Image of confocal scanning across the XZ plane is also provided (blue: DAPI, green: GFP, red: αSA).
Quantification of expression of cycling proteins in GFP+ cardioblasts by fluorescent immunocytochemistry (n = 4 mice).

