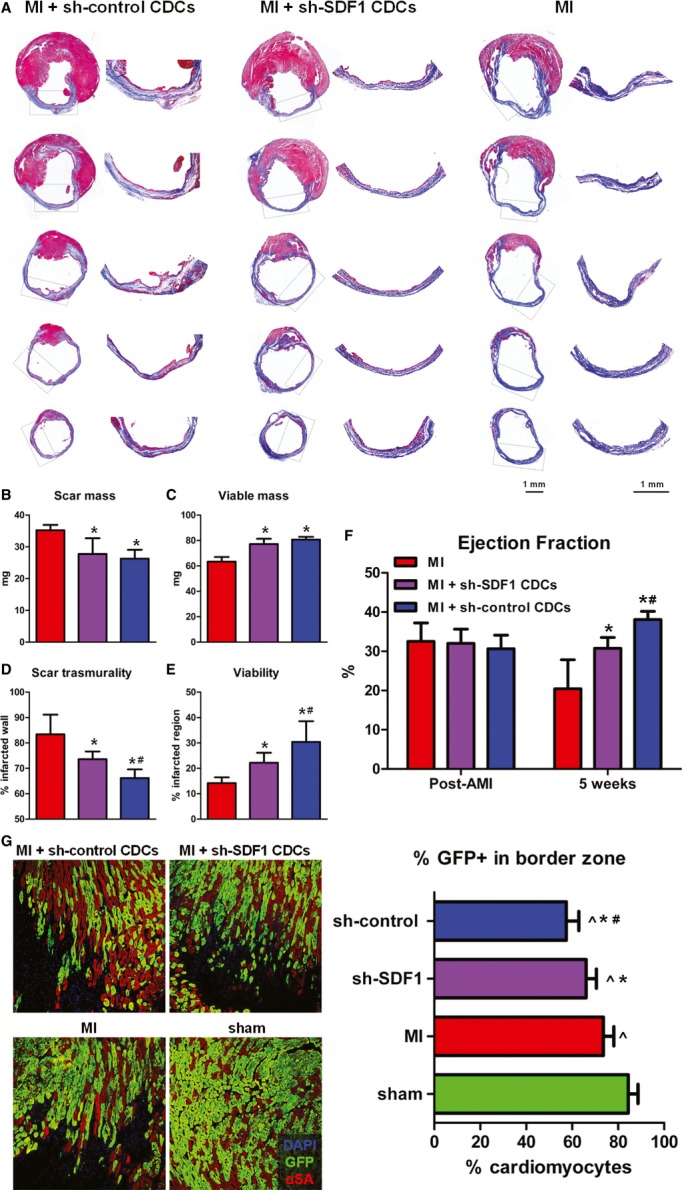
A Representative images of Masson's trichrome-stained infarcted mouse hearts 5 weeks post-MI. Viable heart muscle stains red, while scar stains blue. Five consecutive sections per heart (obtained at 500-μm intervals, starting from the level of LAD ligation toward the apex) are presented. Images on the right are high-power images of the boxed areas on left, showing increased viable myocardium within the infarcted area in sh-control CDC-treated hearts, compared to sh-SDF1 CDC-treated hearts. The scar in infarcted controls (right) is largely transmural.
B–E Morphometric analysis of hearts for the quantification of scar mass (B), viable mass (C), scar transmurality (D), and viability in the infarcted area (E) (*P < 0.05 compared to MI, #P < 0.05 compared to shSDF1-transduced CDCs, n = 5 mice/group).
F Echocardiographic assessment of LV function (*P < 0.05 compared to MI, #P < 0.05 compared to shSDF1-transduced CDCs, n = 5 mice/group).
G Representative fluorescent immunohistochemistry images of the border zone in sh-control CDC-treated hearts, sh-SDF1 CDC-treated hearts, infarcted control hearts, and sham-operated hearts (left). Quantification of the percentage of GFP+ cardiomyocytes in the border zone (right) revealed a more pronounced dilution of the GFP+ myocyte pool by GFP− cardiomyocytes in the sh-control CDC-treated hearts, compared to sh-SDF1 CDC-treated hearts and infarcted control hearts, suggesting increased replenishment of lost cardiomyocytes by endogenous progenitors (∧P < 0.05 compared to sham, *P < 0.05 compared to MI, #P < 0.05 compared to shSDF1-transduced CDCs, n = 5–6 mice/group) (blue: DAPI, green: GFP, red: αSA).

