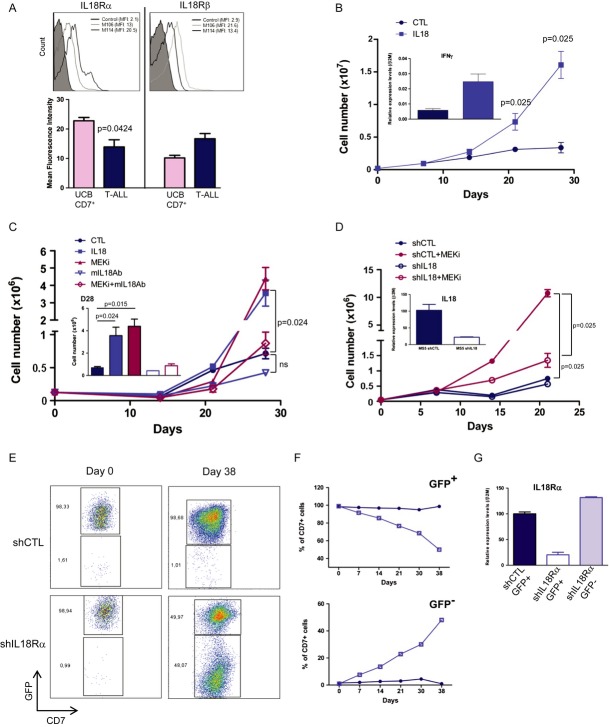
Figure 3. IL-18 promotes T-cell acute lymphoblastic leukaemia (T-ALL) growth in vitro.
- A Cell surface expression of IL-18Rα (left panel) and IL-18Rβ (right panel) in M106 and M114 T-ALL cells. Histograms show the mean fluorescence intensity (MFI) of IL-18Rα and IL-18Rβ staining in, respectively, 7 and 11 T-ALL samples. Control: T-ALL or UCB CD7+ T cells stained with isotype control antibodies.
- B IL-18 stimulates T-ALL cell proliferation. 2.105 M18 T-ALL cells were cultured on MS5 and in the presence or not (CTL) of recombinant human IL-18 for 28 days. Cells were harvested every week, counted and re-plated. Data are representative of five experiments performed in triplicate. Inset shows the quantification of IFN-γ mRNA expression levels in IL-18-treated and control T-ALL samples at day 28 of culture.
- C M30 T-ALL proliferative response when cultured in the presence of MEKi (1 μM PD184352), recombinant IL-18 or an antibody against mouse IL-18 (mIL-18Ab) for 28 days. Data are the mean ± s.d. of triplicates. Results are representative of 2–5 T-ALL samples/condition. n.s., not significant.
- D Proliferative response of M105 T-ALL cells cultured on MS5 cells in which IL-18 was silenced (shIL-18) or not (shCTL) and in the presence or not of MEKi (1 μM PD184352) for 21 days. Inset shows the quantification of IL-18 mRNA in MS5 cells transduced with shIL-18 or shCTL (data are representative of two samples in three experiments performed in triplicate).
- E–G In vitro growth of M105 T-ALL cells in which IL-18Rα was silenced or not with shIL-18Rα/GFP or shCTL/GFP lentiviral vectors. Cells were transduced, sorted for GFP expression (E, day 0) and co-cultured with MS5 cells for 38 days. Quantification of GFP+ and GFP−/low cells at different time points (F). Black line, shCTL cells; grey line, shIL-18Rα cells. At day 38, T-ALL cells were sorted according to their GFP expression and IL-18Rα expression was quantified (G). Two independent experiments were performed.
Data information: Mann–Whitney non-parametric test was used for statistics.

