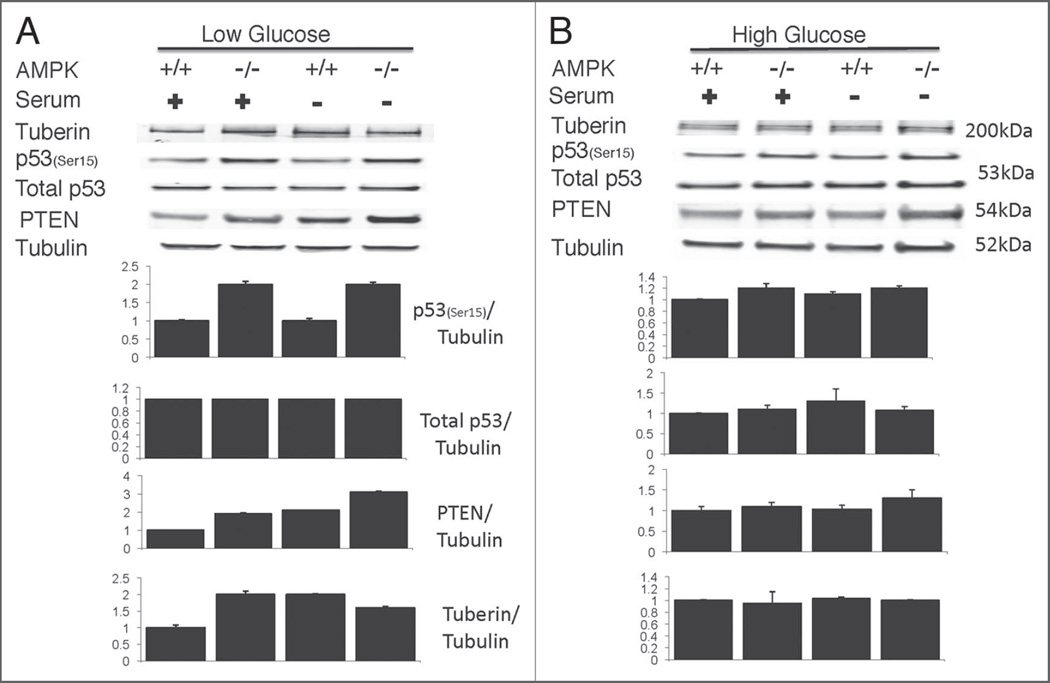
Figure 7.
Increased p53 phosphorylation at Serine 15 (Ser15) and increased PTEN in AMPK−/− cells. Western blot analysis reveals increased phosphorylated p53 and PTEN levels for AMPK−/− cells under either serum starved or serum containing media when cultured in low glucose (A) but not during high glucose cultured conditions (B). Bar graphs represent quantification of indicated protein relative to tubulin, including the standard error of the mean for three independent experiments.

