
Figure 4.
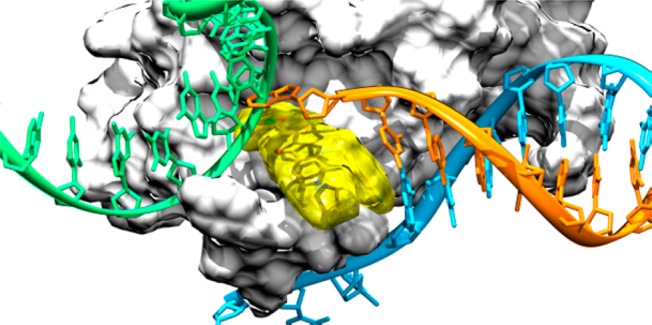
Superimposition between our model of the INSTI/HIV-1 IN CCD/viral DNA ternary complex and the precatalytic TCC from PFV (PDB code 3OS1). IN enzymes are represented as light-gray surfaces. The host DNA (green) and the nonprocessed (cyan) and processed (orange) viral DNA strands are shown as ribbon and sticks. Compound 7b is depicted as yellow transparent surface and sticks.