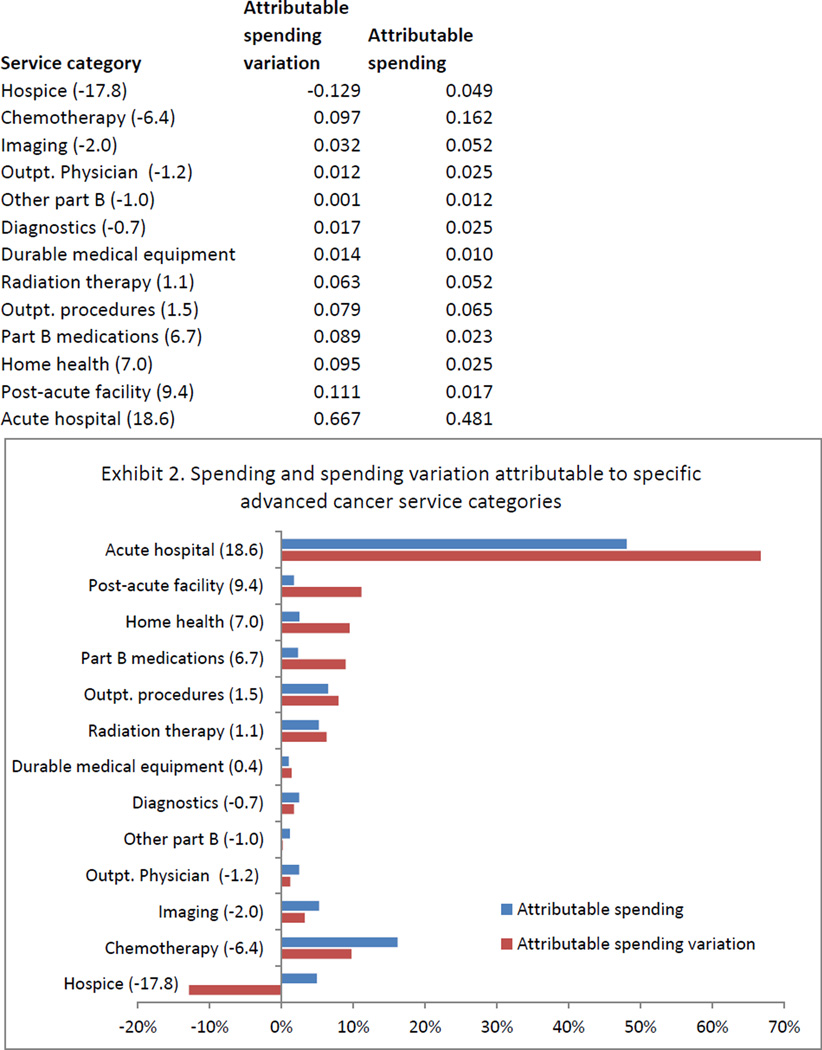
EXHIBIT 2. Spending And Spending Variation Attributable To Specific Advanced Cancer Service Categories.
Source/Notes: SOURCE 2004–10 Medicare claims linked to Surveillance, Epidemiology, and End Results data for 61,838 subjects with advanced cancer. NOTES Numbers in parentheses beside the category label indicate the difference between the percentage of attributable spending variation and the percentage of attributable spending for the associated category. When this number is positive, the category is identified as a net driver of regional spending variation. Attributable variation sums to greater than 100 percent due to covariance terms.

