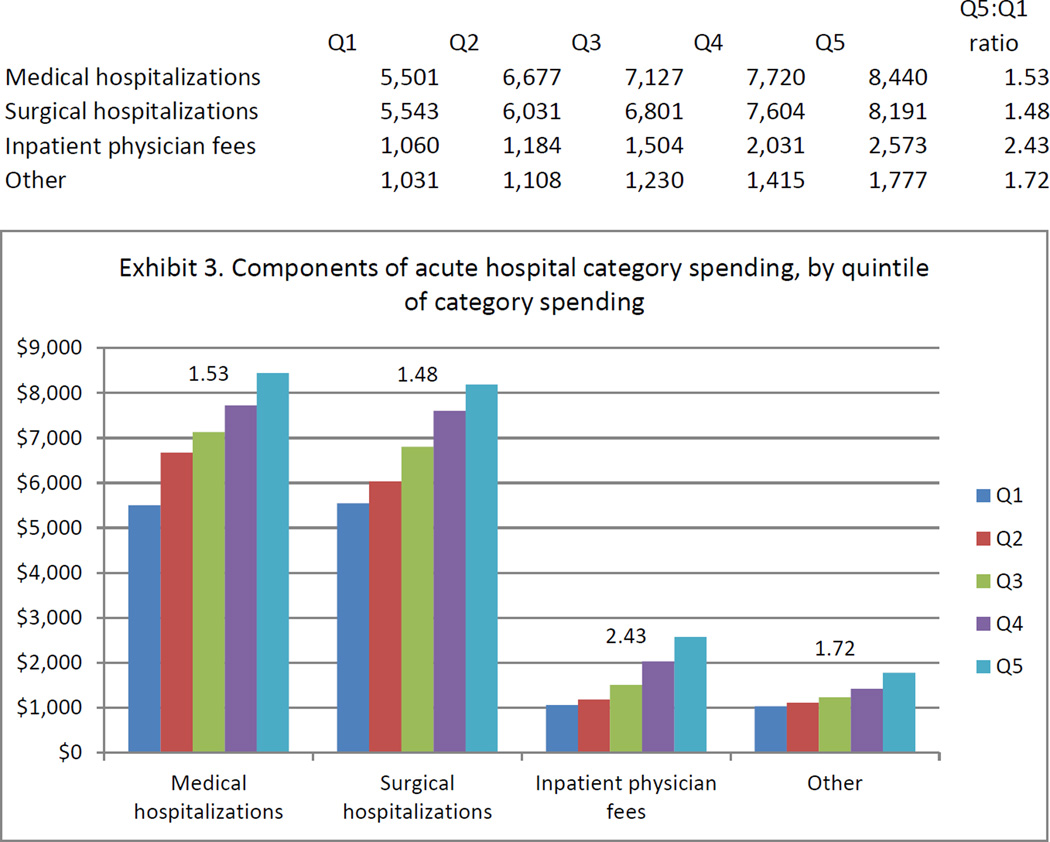
EXHIBIT 3. Components Of Acute Hospital Category Spending, By Quintile Of Category Spending.
Source/Notes: SOURCE 2004–10 Medicare claims linked to Surveillance, Epidemiology, and End Results data for 61,838 subjects with advanced cancer. NOTES The vertical axis shows per capita spending over the first six months after advanced-cancer diagnosis. The number above each series indicates the ratio of spending between quintile 5 (Q5) and quintile 1 (Q1) for the component of category spending represented by that series.

