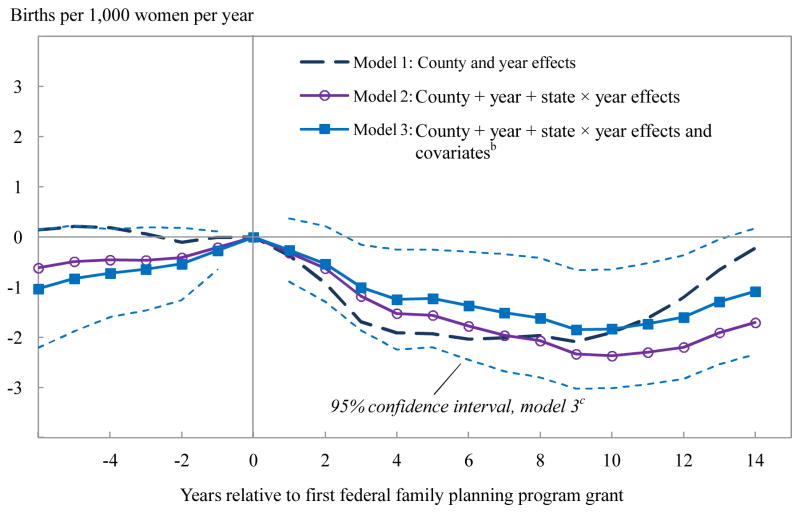
Figure 8. Estimates of the Effects of Subsidizing Family Planning Services on the General Fertility Ratea.
Source: Author’s calculations using data from the National Archives, the Office of Economic Opportunity (1969, 1971, and 1974), and hand-entered data by county from Vital Statistics; Natality Detail microdata from NCHS (2003); and Surveillance Epidemiology and End Results (SEER) data (Surveillance Research Program, National Cancer Institute 2009). See the online appendix for details of the data sources and the regressions. (See Bailey 2012.)
a. The figure plots weighted least-squares estimates of the change in the difference in general fertility rates between counties with and counties without federal family planning grants relative to time zero (y in equation 2). The weights are the 1970 population of women aged 15 to 44. Denominators for 1959–68 were constructed by linearly interpolating information between the 1950, 1960, and 1970 censuses; denominators for 1969–88 use the SEER data. Dashed lines plot 95 percent, pointwise confidence intervals for model 3 based on heteroskedasticity-robust standard errors that account for an arbitrary covariance structure within county.
b. The model adds 1960 county covariates interacted with a linear trend and controls from the REIS data to model 2. See the text for details.
c. Pointwise confidence intervals based on heteroskedasticity-robust standard errors that account for an arbitrary covariance structure within county.

