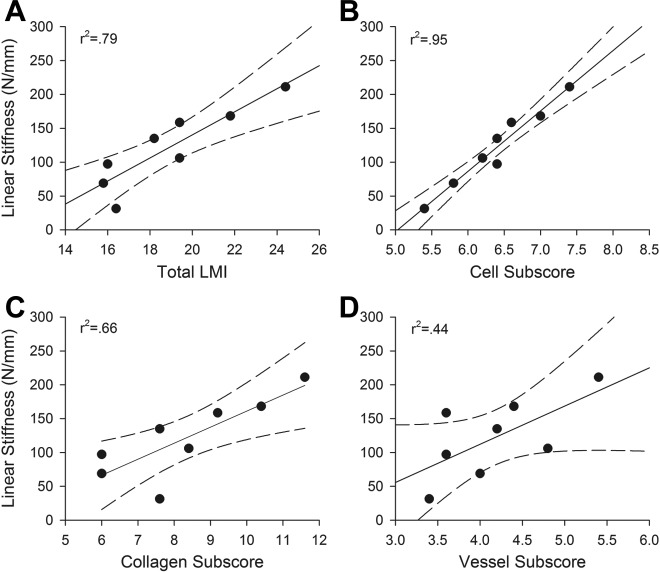
Figure 3.
Linear stiffness of the bioenhanced ACL repair procedure at 6 months of healing as a function of (A) total LMI, (B) cellular subscore, (C) collagen subscore, and (D) vessel subscore. Dotted lines are 95% confidence intervals for slope. A higher LMI in the repair tissue correlated with higher linear stiffness of the tissue, with the cellular subscore resulting in the strongest correlation. Maximum load had similar correlations. ACL, anterior cruciate ligament; LMI, Ligament Maturity Index.

