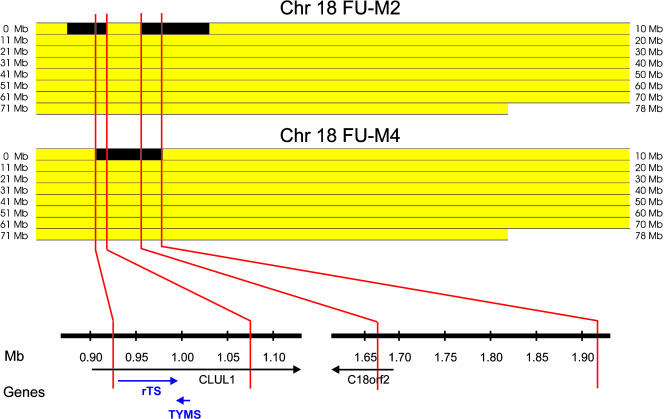
Fig. 1.
Overlapping regions of amplification on chromosome 18p identified by DK. Bitmap views comprised of 18,431 pixels representing tag density values at the chromosomal position of each virtual tag on chromosome 18. Yellow regions indicate tag densities that were not amplified, and black regions represent areas with genomic tag densities indicating amplification. Genomic tag densities were determined as described in Materials and Methods and had maximal values of 10 and 6 copies per diploid genome for the amplifications in FU-M2 and FU-M4, respectively. Genes present within overlapping amplified regions are indicated below on a high-resolution map. Only TYMS and rTS were entirely contained within the regions that were amplified in both FU-M2 and FU-M4.

