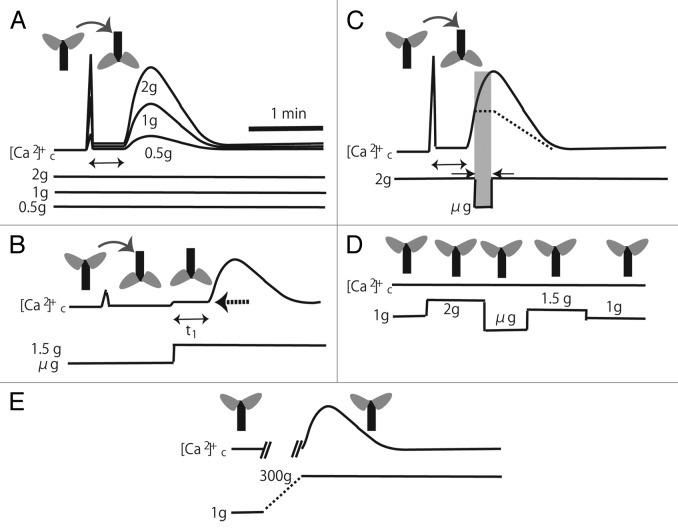
Figure 1. Schematic illustrations of the typical time course of gravistimulus-induced [Ca2+]c-increases. (A), Transient biphasic [Ca2+]c-increases by 180° rotation at 0.5, 1, and 2g conditions. (B), A slow [Ca2+]c-increase by transition from µg to 1.5g. Plants were rotated at µg before the gravity change, and a small transient [Ca2+]c-increase was detected. The aequorin signal during the delay (shown by double headed arrow, tl) is slightly higher (pointed by a dotted arrow) than the basal level. (C), A sudden gravitational decrease from 2g to µg does not attenuate the slow [Ca2+]c-increase induced by 180°-gravistimulation at 2g. The dotted line denotes a hypothetical [Ca2+]c change according to the model in panel (E) in Figure 2. (D), No apparent changes in [Ca2+]c is detected in plants in an upright position by the 1g-2g-µg-1.5g-1g change. (E), 300g-hypergravity stimulation induces a slow [Ca2+]c-increase with a similar time course. The gravitational acceleration increased from 1g to 300g gradually (dotted line). The accurate [Ca2+]c was not monitored during the gravitational acceleration increase due to the experimental setup13(not illustrated).

An official website of the United States government
Here's how you know
Official websites use .gov
A
.gov website belongs to an official
government organization in the United States.
Secure .gov websites use HTTPS
A lock (
) or https:// means you've safely
connected to the .gov website. Share sensitive
information only on official, secure websites.
