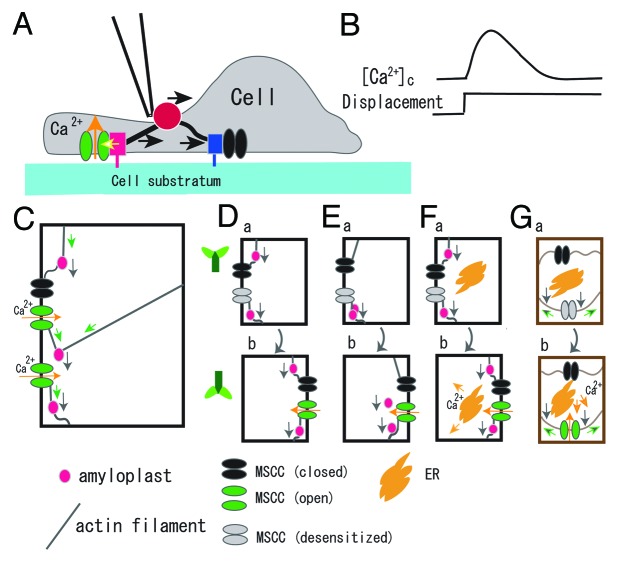
Figure 2. Schematic illustrations of the possible cellular process of sensing the tensile stress increase and the gravistimulus-induced slow [Ca2+]c-increase. (A), Displacement of the FN bead (ca. 1 μm for 10 s) generates tensile stress in the left-side actin stress fiber, activates MSCCs (a red box denotes an FA, and a yellow arrow designates stress that activates the MSCC colored green), while the compressive stress in the right side stress fiber is loaded to an FA (designated by a blue box), but not activate the MSCC colored black. The black arrow above a glass bead (red) indicates the direction of displacement. (B), A transient increase in [Ca2+]c (upper trace) induced by a displacement of the FN bead (lower trace). (C), Activation of MSCCs by the tensile increase in actin filaments. The gravitational force acting on amyloplasts (gray arrows) generates tensile stress (green arrows) and compressive stress designated by buckled lines of actin filaments. Open MSCCs are colored green and closed ones black. See text for more descriptions. (D), A “starch-statolith” model, which consist of amyloplasts, actin filaments, and MSCCs. A MSCC in upper panel (a) is desensitized (colored gray) to continuously applied tensile stress. The MSCC is activated (colored green) by a tensile tension increase when the plant is rotated 180° in panel (b). (E), A conventional “starch-statolith” model, which includes sedimentation of amyloplasts when the specimen rotated 180°. (F), A “starch-statolith” model with a signal transduction pathway that triggers Ca2+ release. (G), A “non-statolith-statolith” model. The cell wall (brown) and the plasma membrane (dark brown) are illustrated separately. Pressing the membrane (gray arrows) causes the stress increase in the membrane (green arrows). Ca2+ flux is shown by yellow arrows. The direction of plants is illustrated in the side of panel D.

An official website of the United States government
Here's how you know
Official websites use .gov
A
.gov website belongs to an official
government organization in the United States.
Secure .gov websites use HTTPS
A lock (
) or https:// means you've safely
connected to the .gov website. Share sensitive
information only on official, secure websites.
