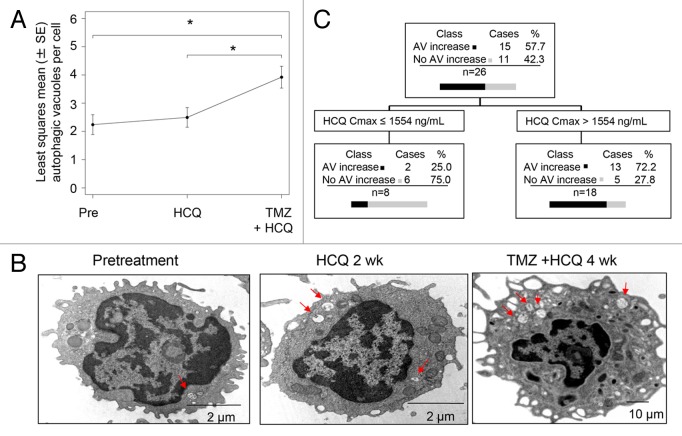
Figure 3. Pharmacodynamic effects of TMZ and HCQ on autophagic vacuole accumulation in PBMC, and PK-PD correlation. (A) Mixed-effects model of mean ± SD autophagic vacuoles (AVs)/cell in PBMC. Dotted line: regression line. (B) Representative electron micrographs of serial PBMC; red arrows: AV (C) Classification tree from CART analysis. (D) Histogram of AV change at 2 wk in patients with estimated HCQ Cmax above or below 1554 ng/mL.

An official website of the United States government
Here's how you know
Official websites use .gov
A
.gov website belongs to an official
government organization in the United States.
Secure .gov websites use HTTPS
A lock (
) or https:// means you've safely
connected to the .gov website. Share sensitive
information only on official, secure websites.
