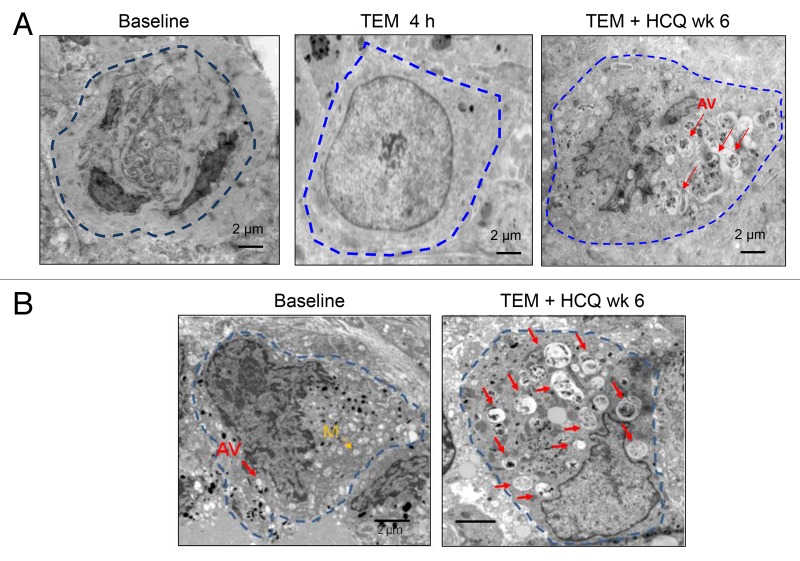
Figure 3. Therapy-associated autophagic vacuole accumulation in serial tumor biopsies from melanoma patients. Representative electron micrographs of a melanoma cell from 2 different patients (A and B) at the indicated timepoints. Dotted blue line: border of cytoplasmic membrane of 1 tumor cell. Red arrows, autophagic vacuoles. Yellow arrow, mitochondria.

An official website of the United States government
Here's how you know
Official websites use .gov
A
.gov website belongs to an official
government organization in the United States.
Secure .gov websites use HTTPS
A lock (
) or https:// means you've safely
connected to the .gov website. Share sensitive
information only on official, secure websites.
