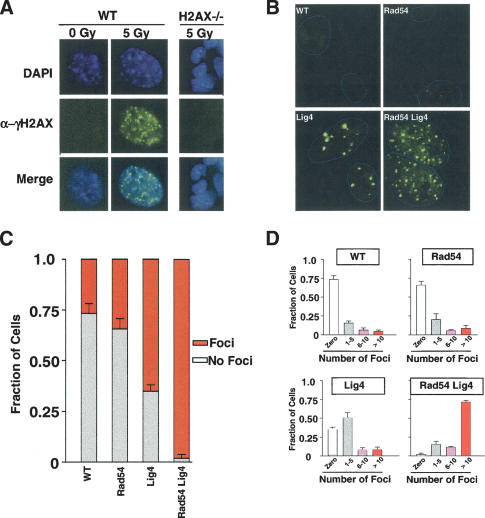
Figure 2.
Immunofluorescent detection of γ-H2AX foci. (A) Wild-type MEFs stained for γ-H2AX foci following either mock treatment (0 Gy) or irradiation (5 Gy). (Upper panels) DAPI staining of nuclei. (Middle panels) γ-H2AX signal. (Bottom panels) Merged signals. Genotypes and irradiations conditions are as indicated. (B) Immunofluorescent detection of γ-H2AX foci in untreated MEFs of the indicated genotypes. Nuclear boundaries, as determined by DAPI staining (not shown), are indicated in blue and digitally overlaid on the FITC images. (C) Percentage of cells exhibiting γ-H2AX foci (red bars) versus no foci (white bars) is shown for each of the indicated genotypes. (D) Percentage of cells exhibiting zero (white bars), 1-5 (gray bars), 6-10 (pink bars), or more than 10 (red bars) foci is shown for each of the indicated deficiencies. All counts represent averages derived from three to five independent experiments.

