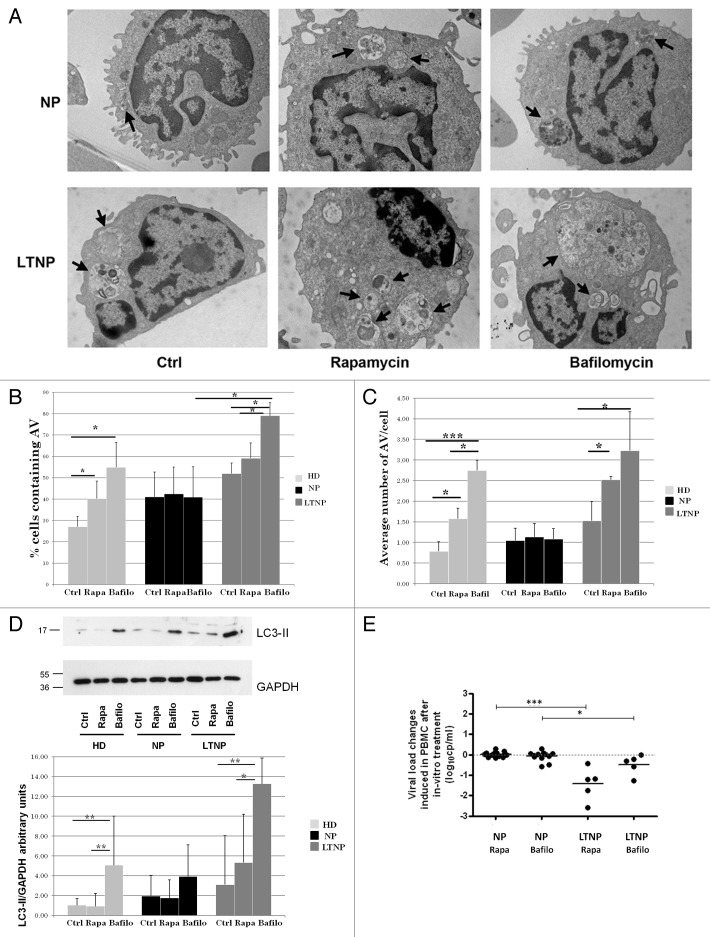
Figure 4. Pharmacological modulation of autophagy. (A) Electron microscopy analysis of PBMC from NP and LTNP treated with the autophagy inducer rapamycin, and the autophagy inhibitor bafilomycin A1. Arrows indicate AV containing undigested material. (B) Electron microscopy quantification of the percentage of cells containing AV in HD, NP, and LTNP. (C) Quantitative analysis of the average number of AV per cell in HD, NP, and LTNP. (D) WB analysis of LC3-II protein. In the graph were reported the mean values of 4 different experiments. (E) Changes in HIV RNA release in culture supernatants of NP and LTNP PBMC, after in vitro treatment with autophagy modulators rapamycin and bafilomycin A1. The difference in HIV RNA concentration between untreated and rapamycin- or bafilomycin A1-treated PBMC was calculated for each sample and reported in the figure. Original magnification: (A) 12.000×. *P < 0.05, **P < 0.01, ***P < 0.001.

An official website of the United States government
Here's how you know
Official websites use .gov
A
.gov website belongs to an official
government organization in the United States.
Secure .gov websites use HTTPS
A lock (
) or https:// means you've safely
connected to the .gov website. Share sensitive
information only on official, secure websites.
