
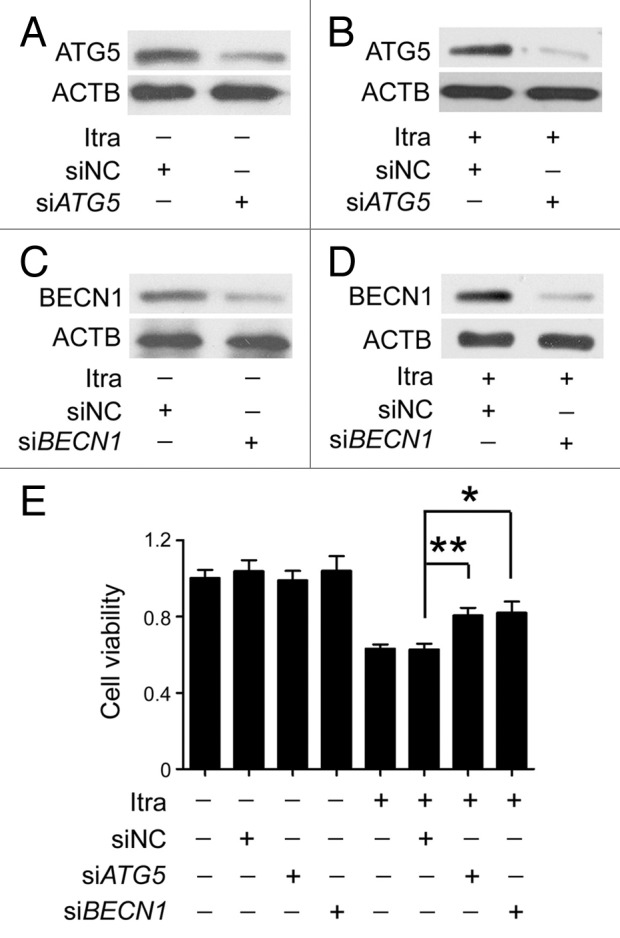
Figure 4. Inhibition of autophagy represses the antiproliferative effect of itraconazole. (A) U87 cells were transfected with siNC (negative control) or siATG5 for 72 h, and expression of ATG5 was examined by immunoblot. The data are representative of 3 independent experiments. (B) U87 cells were transfected with siNC or siATG5 for 36 h, and then treated with 5 μM itraconazole for another 36 h. Expression of ATG5 was examined by immunoblot. The data are representative of 3 independent experiments. (C) U87 cells were transfected with siNC or siBECN1 for 72 h, and expression of BECN1 was examined by immunoblot. The data are representative of 3 independent experiments. (D) U87 cells were transfected with siNC or siBECN1 for 36 h, and then treated with DMSO or 5 μM itraconazole for another 36 h. Expression of BECN1 was examined by immunoblot. The data are representative of 3 independent experiments. (E) U87 cells were transfected with siNC, siATG5, or siBECN1 for 36 h, and then treated with 5 μM itraconazole for another 36 h. Cell proliferation was examined by the MTT assay. The data are representative of 5 independent experiments for the MTT assay. *P < 0.05; **P < 0.01; Itra, itraconazole.