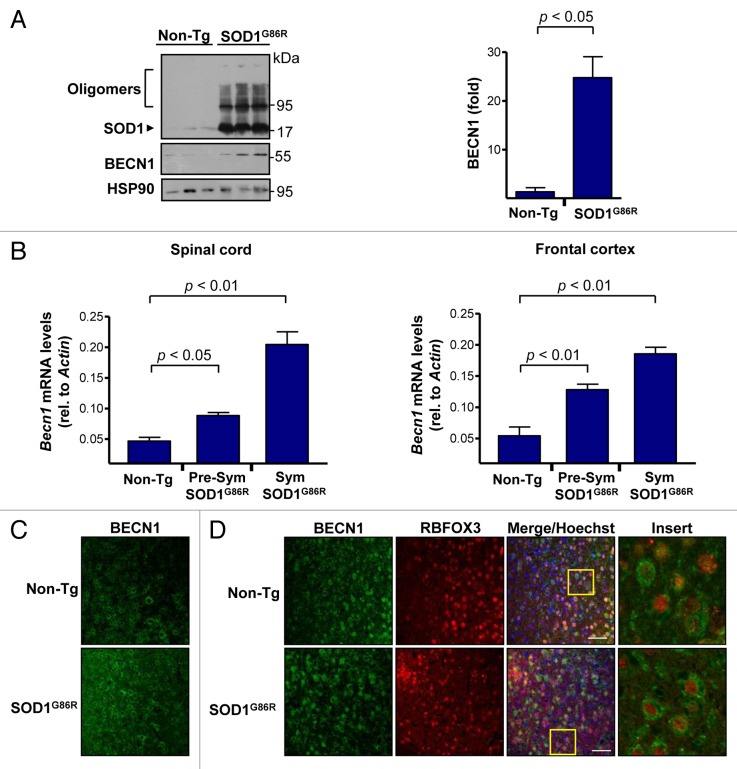
Figure 1. Increased levels of BECN1 in the spinal cord and frontal cortex of transgenic SOD1G86R mice. (A) SOD1 oligomers, BECN1, and HSP90 expression were determined in spinal cord protein extracts from symptomatic SOD1G86R transgenic (end point of disease) or non-transgenic litter mate control mice (Non-Tg) by western blot. Each lane represents an independent mouse. HSP90 was monitored as a loading control. Right panel: quantification of BECN1 expression levels in spinal cord of transgenic SOD1G86R mice and non-transgenic age-matched controls. Mean and standard error are shown for 3 independent animals per group. (B) In parallel, Becn1 mRNA levels were measured by real-time PCR in the SOD1G86R transgenic mice at the presymptomatic stage (Presym; 90 d after birth) or end point of disease (Sym) in spinal cord (left panel) and in frontal cortex (right panel). Mean and standard error are shown for the analysis of 3 animals per group. (C) Immunofluorescence assay of BECN1 and RBFOX3 staining were performed in frontal cortex tissue derived from SOD1G86R and non-transgenic litter-mate control mice (Non-Tg). A merged image of the triple staining is presented. (D) Using samples described in (C), the expression of BECN1 and the neuronal marker RBFOX3 were analyzed by indirect immunofluorescence followed by confocal microscopy analysis. The right panel shows a magnification of the area marked with a yellow square. A representative image is presented of the analysis of at least 3 independent animals for genotype. Scale bars: 50 μm.

An official website of the United States government
Here's how you know
Official websites use .gov
A
.gov website belongs to an official
government organization in the United States.
Secure .gov websites use HTTPS
A lock (
) or https:// means you've safely
connected to the .gov website. Share sensitive
information only on official, secure websites.
