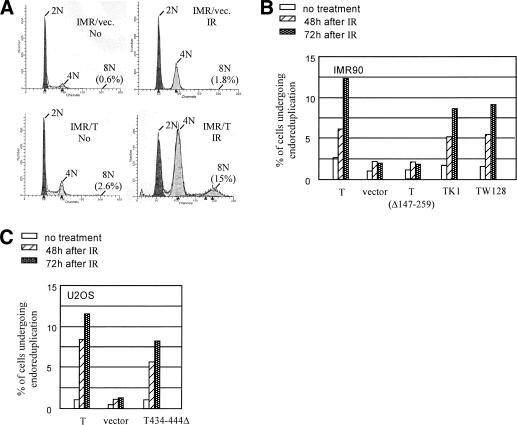
Figure 4.
T induces endoreduplication in IMR90 cells after IR. The experiment was repeated at least three times with similar results, and the results of a representative experiment are shown. (A) IMR90 were infected with a backbone retroviral vector or the vector encoding T. Cell cycle profile was monitored by flow cytometry before and 72 h after IR (2 krads). The percentage of cells with 8N DNA content is indicated. Similar results were obtained when cells were irradiated with 0.8 krad. (B) IMR90 cells were infected with retroviruses encoding wild-type T and certain T mutants, including the internal deletion mutant (Δ147-259), a pocket protein-binding-defective species, K1, and a missense species defective in SV40 replication origin binding, W128. Infected cells were selected in G418. Expression levels of T and the T mutants were approximately equal in the various cultures (data not shown). The empty vector, pBabe Neo, was used as a negative control (Vector). FACS analysis was performed before and 48 h or 72 h after IR (2 krads), and the percentage of cells that had experienced endoreduplication (i.e., displayed a >8N DNA content as defined by FACS) was plotted. (C) U2OS cells were infected with retroviruses encoding wild-type T, a T mutant defective in p53 binding (T434-444Δ), and a pBabe-Neo vector. After G418 selection, stable transformants were examined for endoreduplication 48 or 72 h after IR (2 krads). The percentage of cells that had experienced endoreduplication is depicted.

