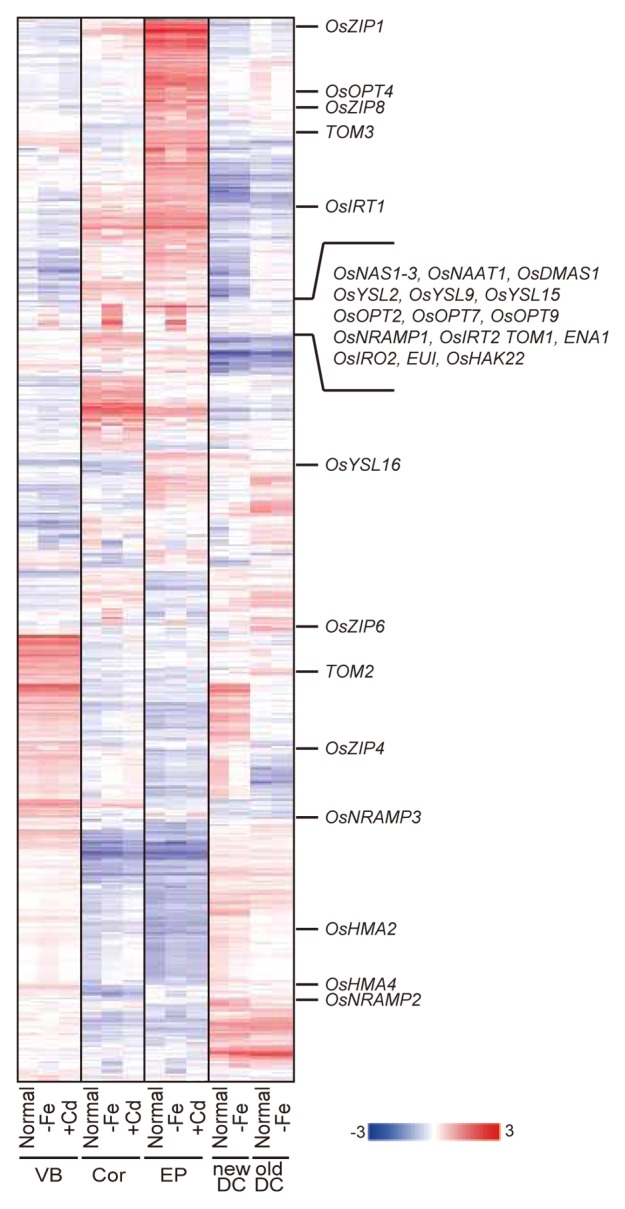
Figure 1. Expression profiles of the genes involved in metal homeostasis. Clustering analysis of genes whose expression changed in at least one tissue or under one condition. The gene-normalized signal intensities are shown in heat maps using a log10 scale. Hierarchical clustering was performed as described previously.13 OsNAS1–3, nicotianamine synthase; OsNAAT1, nicotianamine aminotransferase; OsDMAS1, deoxymugineic acid synthase; OsYSL2, Fe(II)–nicotianamine synthase; OsYSL15, 16, Fe(III)–DMA transporter; OsYSL9, YSL transporter with unknown substrates; OsIRT1, 2, Fe(II) transporter; TOM1, DMA efflux transporter; TOM2, 3, homologous genes of TOM1; ENA1, nicotianamine efflux transporter; OsIRO2, Fe deficiency-inducible transcription factor; OsNRAMP1, Fe transporter with broad substrates; OsNRAMP2 and 3, NRAMP transporters with unknown substrates; OsZIP4 and 8, Zn transporters; OsZIP1 and 6, ZIP transporters with unknown substrates; OsHMA2, Zn/Cd transporter; OsHMA4, HMA transporter with unknown substrates; EUI, gibberellin-deactivating enzyme; OsHAK22, high-affinity potassium (K+) transporter.
