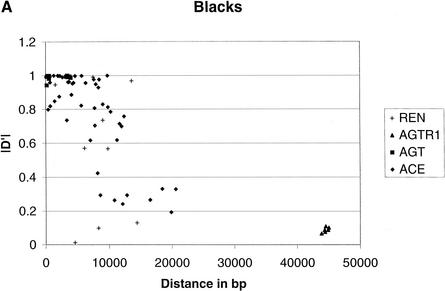
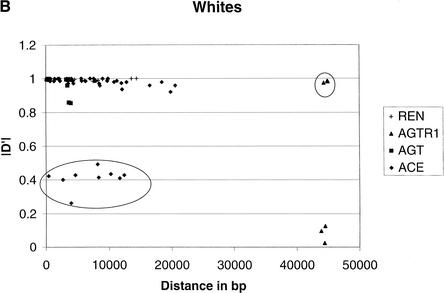
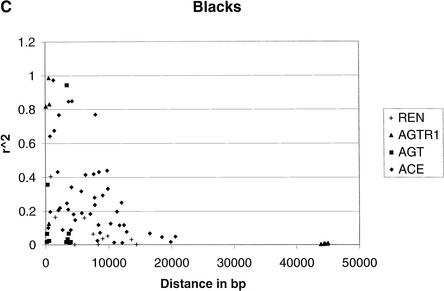
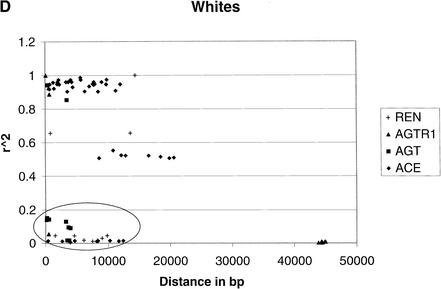
Figure 1.
Comparison of LD between blacks and whites based on D‘ and r2. (A) |D‘| for blacks. (B) |D‘| for whites. (C) r2 for blacks. (D) r2 for whites. In blacks, both D‘ and r2 decay as the distance increases, although considerable variation is observed. In whites, the decay of D‘ values demarcated by the ellipse are apparently owing to the effects of rare minor allele frequency (ACE A7941G, f(G) = 0.05). The rare minor allele frequency (AGTR1 A44221G, f(G) = 0.05) is also associated with D‘ values of 1, as indicated in the circle. Excluding the D‘ values in the ellipse and the circle leads to a slower decay of the D‘ value in whites as the distance increases than that in blacks. Similarly, the low r2 values in the ellipse among whites are caused by the minor alleles being rare. These r2 values are derived from at least one SNP with an allele frequency <0.15. After excluding these values, r2 decays as the distance increases.


