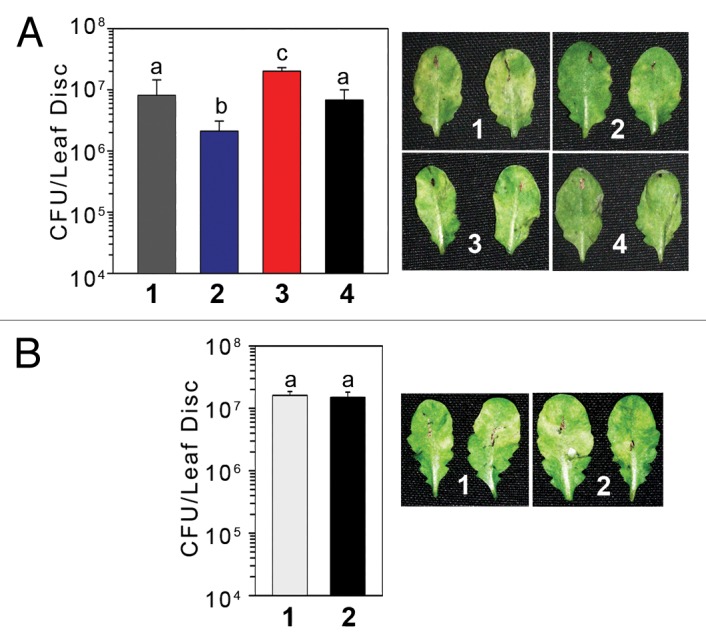
Figure 1. Effect of 2-PCPA on SAR and local resistance. (A) Bacterial numbers and disease symptoms after 3 d of challenge inoculation with Psm (2°). The plants were either pre-treated with 10 mM MgCl2 or Avr-Pst (1°) at 1 X 10⁷cfu/ml with or without 2-PCPA 3 d before the challenge inoculation. Secondary challenge inoculation in all plants were performed with Psm at 5 X 10⁵ CFU/ml (2 o). 1- 1° treatment with 10 mM MgCl2 and 2° treatment with Psm. 2- 1° treatment with Avr-Pst and 2° treatment with Psm, 3 - 1° treatment with Avr-Pst + 2-PCPA and 2° treatment with Psm, 4 - 1° treatment with Avr-Pst, and 2° treatment with Psm+ 2-PCPA. (B) Psm counts from locally inoculated leaves and disease symptom at 3 dpi with or without 2-PCPA.Inoculation was done at 5X10⁵ CFU/ml. Each bar represents the mean ± standard deviation (SD) of 4 samples each carrying 5 leaf discs of 5 mm diameters randomly taken from different plants. Letters above the bars indicate values that are significantly different (P < 0.05) from each other as analyzed by one-way ANOVA (post hoc Holm Sidak method).
