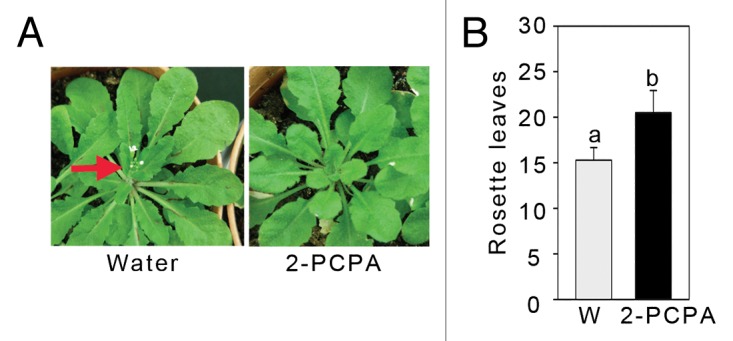
Figure 3. Effect of 2-PCPAon flowering. (A) Flowering phenotypes after treatment with water or 2-PCPA. Arrow indicates flowering in water treated plants. (B) Rosette leaves number at the time of transition. Leaves were counted just before the transition took place. Plants were kept in photoperiod condition 12 h-12 h, light-dark condition. Letters above the bars indicate values that are significantly different (P < 0.05) from each other as analyzed by one-way ANOVA (post hoc Holm Sidak method).
