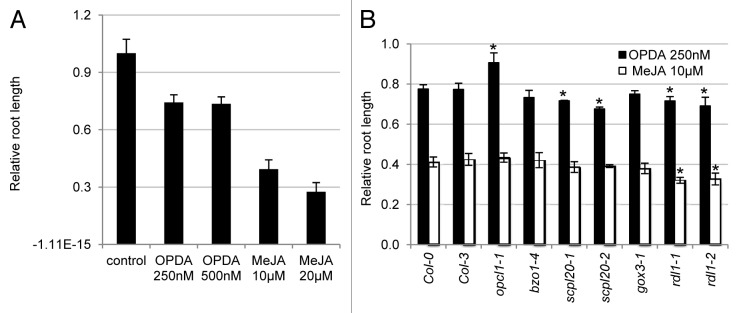
Figure 1. OPDA response assay. (A) Testing the effect of OPDA and MeJA on root elongation in wild-type plants. Y-axis indicates relative root length (ratio between root length under treatment and root length with no treatment) of 7-d Col-0 seedlings grown on ½ LS medium supplemented with 0.5% sucrose and OPDA or MeJA. Data represent means ± se of 3 independent experiments. For each experiment, n ≥ 30. (B) Root response to OPDA and MeJA in peroxisomal mutants. Y-axis indicates relative root length (ratio between root length under treatment and root length with no treatment) of 7-d seedlings grown on ½ LS medium supplemented with 0.5% sucrose and 250 nM OPDA or 10 µM MeJA. Data represent means ± se of 3 independent experiments. For each experiment, n ≥ 30. Asterisks indicate statistically significant changes from the wild type (Col-0 or Col-3). bzo1–4, scpl20–2, gox3–1, and rdl1 mutants are in Col-0 background, and scpl20–1 mutant is in Col-3 background. Student t-test, P < 0.001.
