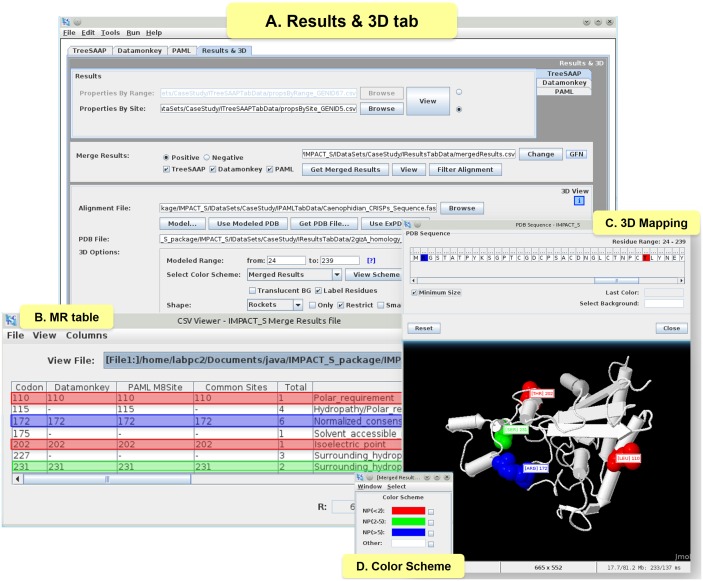
Figure 5. 3D mapping and related functionalities under Results & 3D tab.
(A) ‘Results & 3D’ tab with the results of the CRiSPs case study, (B) ‘MR table’ (Table S3) presenting six columns: ‘Codon’ containing the site found as positive selected (TreeSAAP – Z-score ≥3.09); ‘Datamonkey’ with the positive selected common sites positions from SLAC, FEL, REL, MEME and FUBAR; ‘PAML M8Site’ with the information from BEB results M8; ‘Common Sites’ – reporting the site position common to all the previous mentioned columns; ‘Total’ - count of the number of properties per site; ‘Properties (7–8) (+)’ with the names of properties found under categories 7 and 8 for Z-score ≥3.09, (only common sites are shown and highlighted) (C) 3D structure and ‘PDB Sequence’, mapping the sites positions from the ‘Common Sites’ column following the (D) Merged Results ‘Color Scheme’ according to a pre-defined number of properties: red – less than 2 (NP<2), green - between 2 and 5 (NP(2–5)) and blue - more than 5 (NP>5).

