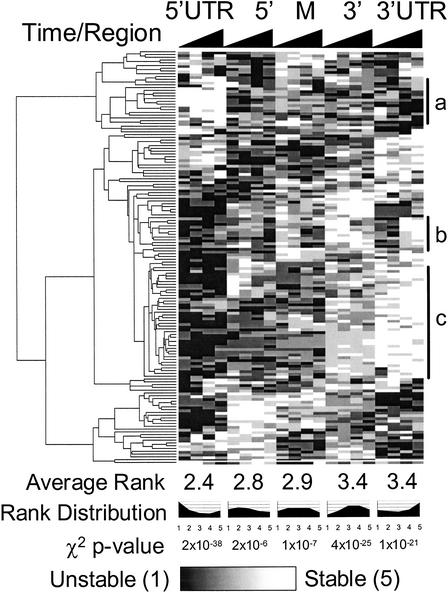
Figure 2.
Whole-genome cluster analysis of operon degradation. The degradation patterns of 149 operons (containing two or more ORFs, and oligo probes in all targeted regions) were hierarchically clustered after ranking the relative degradation rate of each region. The algorithm was implemented using the GeneCluster/TreeView package (Eisen et al. 1998). Transcript regions are on the x-axis, with each region split into 2.5-, 5-, 10-, and 20-min timepoints. The average rank increases from 5′ to 3′, supporting a predominant 5′ to 3′ directionality of degradation (cluster c). The clustering also reveals that a variety of degradation patterns are present, such as operons with relatively stable 5′ UTRs (cluster a). One group of operons (cluster b) is initially degraded most quickly at its 3′ UTR at 2.5 and 5 min, but then by the 10 min timepoint is more quickly degraded at its middle and 3′ coding regions. χ2 goodness of fit tests show that the distributions of degradation ranks are highly nonrandom, with 5′ regions more likely to be degraded quickly and 3′ regions more likely to be degraded slowly. The complete clustering file, including gene names, is available at http://arep.med.harvard.edu/rna_decay/.

