
Fig. 4.
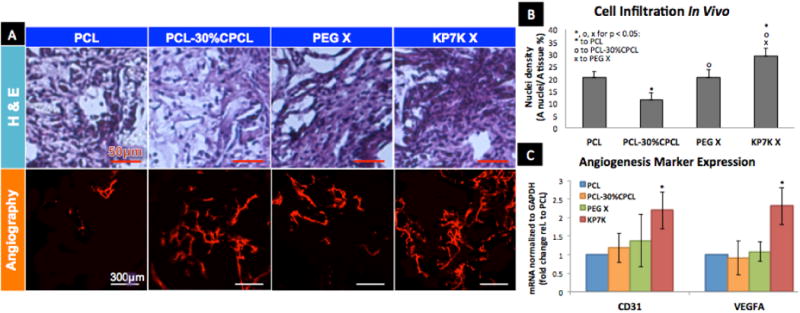
(A) After 2-week subcutaneous implantation, scaffolds were stained with H&E (purple: cytoplasm, dark blue: nuclei; scale bar = 50 μm), and imaged for angiography (scale bar = 300 μm). (B) Cell infiltration was quantified by Area (nuclei) / Area (tissue) (%) from H&E stained sections. (C) mRNA expression of angiogenesis markers by qRT-PCR (N=4; Error = ±1 SEM).