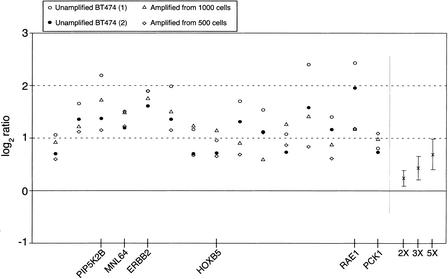
Figure 7.
Repeatability of observed log2 ratios for the set of 15 genes that were identified as significantly amplified in all BT474 experiments. For each experiment, genes were selected using nonparametric methods that flagged log2 ratios beyond the third quartile plus 2.5 times the Interquartile Range of the observed distribution. (Unamplified BT474) Corresponds to the comparison of unamplified BT474 DNA versus unamplified female DNA. (Amplified from 1000 cells) and (Amplified from 500 cells) correspond to the comparison of amplified DNA from inputs equivalent to 1000 and 500 BT474 cells, respectively, against amplified normal female DNA from similar inputs. On the right side of the plot are shown the actual average ratios and standard deviations for X-chromosome copy-number variations corresponding to ratios of 2:1, 3:1, and 5:1. Using the average value for all four ERBB2 ratios (1.791 in log2 scale) and the calibration curve derived from the average ratios for 2X, 3X, and 5X (0.234, 0.423, and 0.681, respectively, in log2 scale), we calculated a hypothetical ratio of 12.5 for this gene. This ratio value is in agreement with amplification values determined by other methods (Lucito et al. 1998), that reported copy number increases in the range of 10–15 for ERBB2 in the breast cancer cell line BT474. Seven of the amplified genes are located in the chromosomal arm 17q (among them PIP2KB, MNL64, ERBB2, and HOXB5), and six probes are located in the chromosomal arm 20q (among them RAE1 and PCK1).

