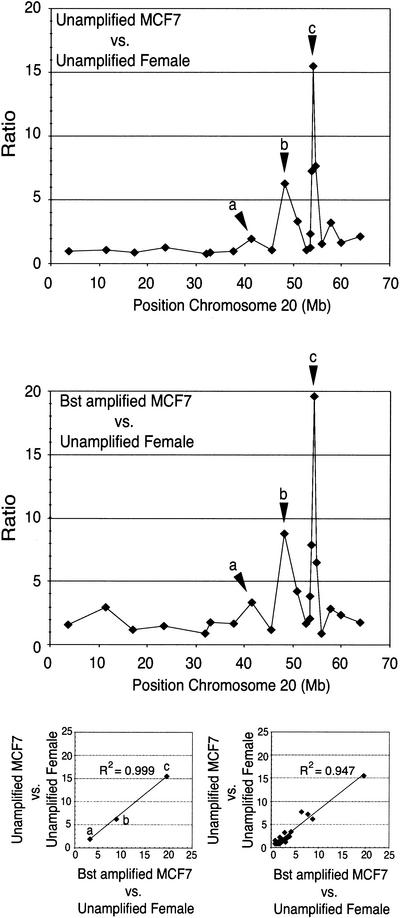
Figure 8.
Analysis of breast cancer cell line MCF7 using BAC clones located in Chromosome 20. The graph on the top shows the copy-number variation for the array–CGH experiment corresponding to the hybridization of genomic DNA from the cell line MCF7 against female DNA. The graph in the middle shows the equivalent experiment performed with isothermal whole genome-amplified DNA from MCF7 against female DNA. Regions of copy number increase are remarkably conserved for the isothermal whole genome-amplified DNA from MCF7. The lower left scatter plot shows the high correlation obtained for the ratios of the three loci showing the largest amplification. The lower right scatter plot shows the correlation coefficient for all the ratios in both experiments.

