
Fig. 2.
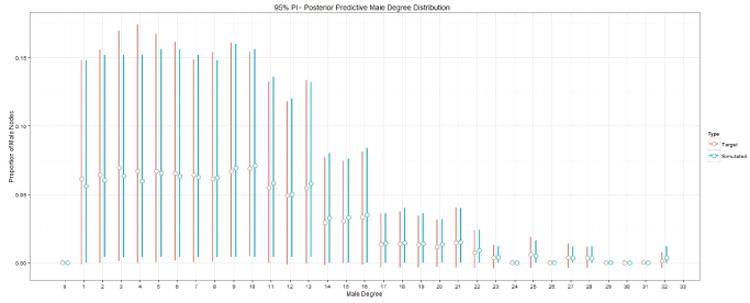
The red and blue bars represent the target PPSNSD and the simulated PPSNSD for males, respectively. The open circle on each bar denotes the mean value of the marginal distribution.
Official websites use .gov
A
.gov website belongs to an official
government organization in the United States.
Secure .gov websites use HTTPS
A lock (
) or https:// means you've safely
connected to the .gov website. Share sensitive
information only on official, secure websites.
The red and blue bars represent the target PPSNSD and the simulated PPSNSD for males, respectively. The open circle on each bar denotes the mean value of the marginal distribution.