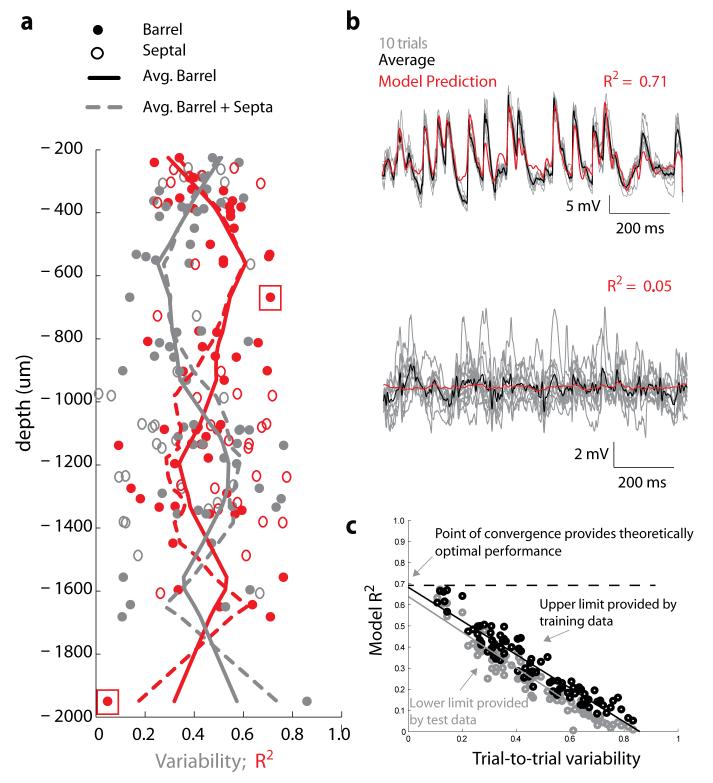
Figure 2. Linearized model captures a majority of the predictable synaptic input for neurons in all layers of S1.
a, Depth dependent relationship of the model performance and neural variability. Model performance (red) – defined as the cross-validated prediction of the VWA on trial averaged responses; – and neural variability (grey) – defined as the trial-to-trial variability between repeated presentations of identical stimuli, are plotted as a function of recording depth for each neuron. There is an inverse relationship between the model performance and neural variability in all neurons and layers. b, Responses of a neuron to ten repetitions of the same stimulus (gray traces) to illustrate neural variability along with the average response (blue) and predicted response (red). The two examples correspond to the data points inside red boxes in 2A, and represent examples of neurons with high prediction quality and low variability (top) and low prediction quality and high variability (bottom). c, The model performance (R2) tested on single-trial responses using training data (black) and cross-validation/test data (grey) is plotted against the trial-to-trial variability for each neuron. Convergence of the test-performance and training-performance at zero variability between an R2 of 0.64 and 0.68.

