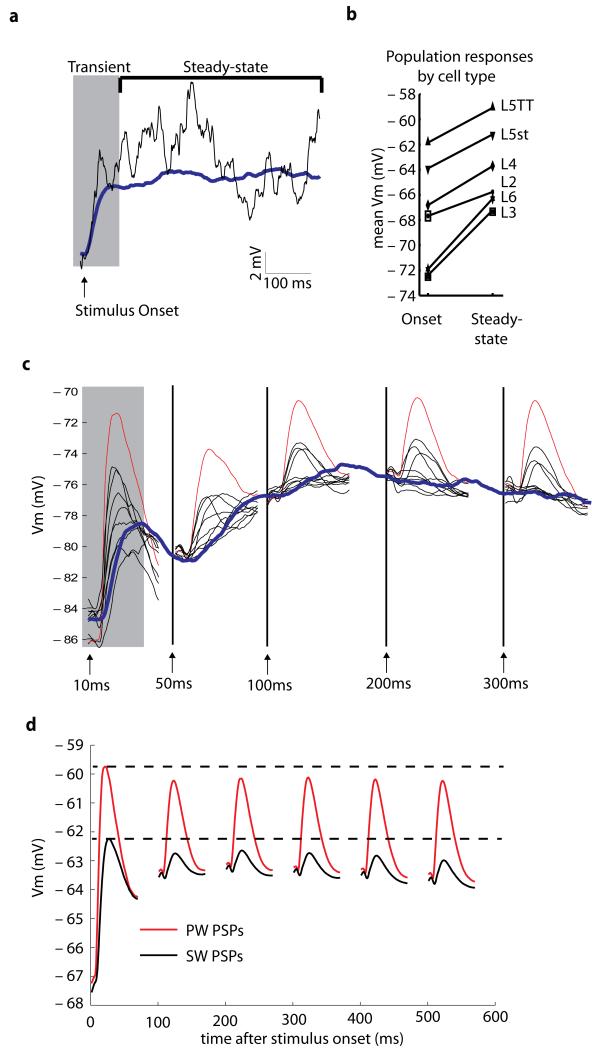
Figure 6. Neural adaptation underlying receptive field changes.
a, The trial averaged response of a neuron over 300 unique trials of complex stimulus (blue) and the response to a single trial (black) reveals a strong stimulus transient and tonic depolarization that is dependent on stimulus onset. b, Comparison of the mean Vm at stimulus onset and during steady-state response reveals a tonic depolarization of 1-5 mV for each cell type and layer. c, The response to PW deflections (red) and the eight SW deflections (black) depends on the state of the neuron and/or circuit. The average PW and SW deflections were measured during the five epochs indicated by the arrows. The trial averaged response is shown in blue. d, For all neurons (N = 86), the average PSP amplitude and peak Vm for PW and the average for the eight SWs (as in C) are plotted in time. Peak potentials for the PW (red) and SWs (black) remain relatively invariant and the main factor affecting PSP size is the tonic depolarization of membrane potential during adaptation.

