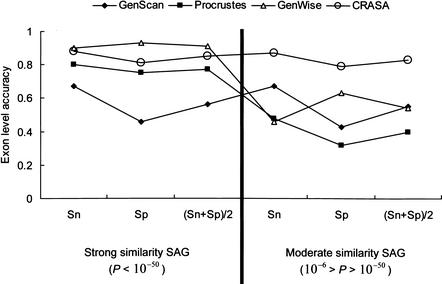
Figure 2.
The exon-level accuracy of different annotation tools tested with the SAG data sets. The strong (left panel) and moderate (right panel) similarity groups contain 17 and 26 sequences, respectively. The Sn, Sp, and (Sn + Sp)/2 and measures of CRASA for the strong similarity data set are 0.88, 0.81, and 0.85, respectively, and for the moderate similarity dataset are 0.87, 0.79, and 0.83, respectively.

