
Figure 2.
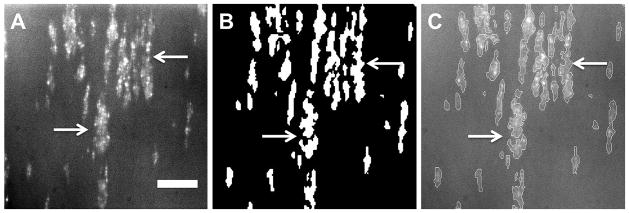
Image analysis to quantify the percent platelet surface coverage. A) Original fluorescent image of platelets adhered to SiC after 5 min of perfusion, B) binary image rendered by the MatLab program, C) original fluorescent image overlaid with the outline of the binary image. Scale bar = 40 μm