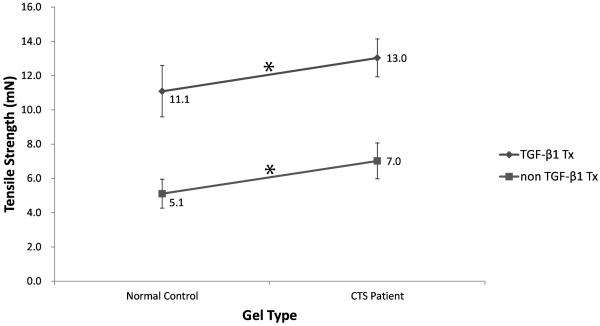
Figure 6.
Interaction diagram showing the differences in mean tensile strength by group. Values for gels seeded with normal control cells and CTS patient cells were significantly different within the TGF-β1 treatment group and within the untreated group (*, p<0.05), but not between cell type and TGF-β1 treatment type.

