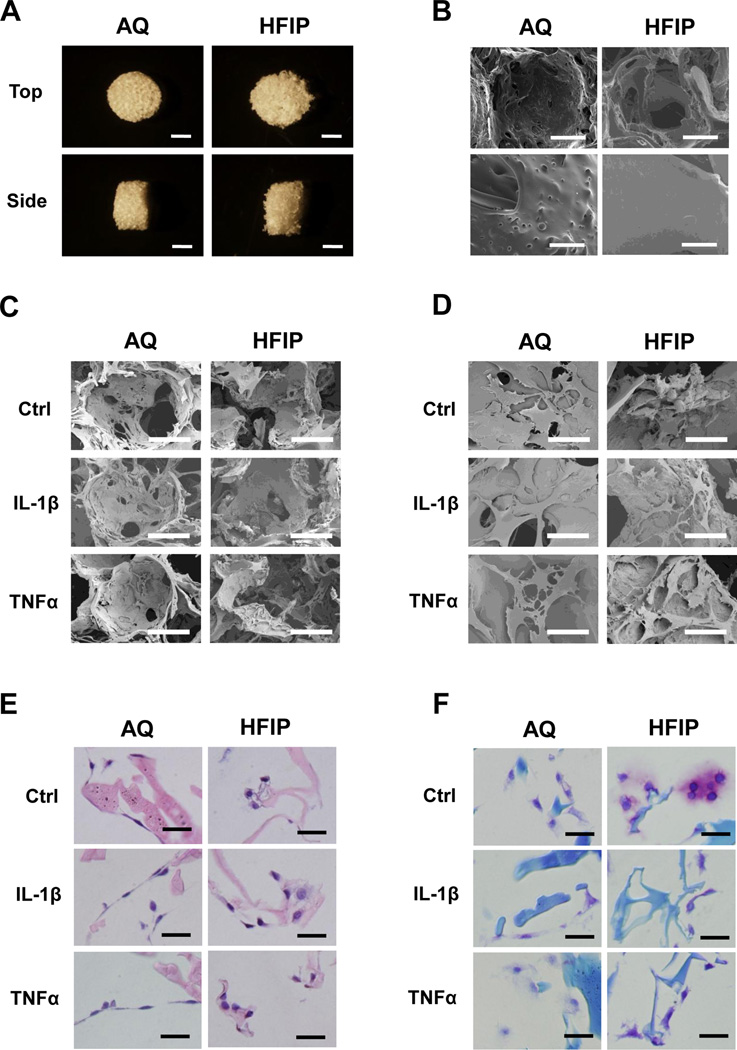
Fig. 1. Morphological and histological characterization of chondrocytes in AQ and HFIP silk scaffolds.
(A) Bright field images of AQ and HFIP silk scaffolds. Top views (top panels) and side views (bottom panels) of the scaffolds. Scale bars: 2mm. (B) Scanning electron microscopic (SEM) images of AQ and HFIP silk scaffolds. Top panels: low magnification, scale bar: 200µm. Bottom panel, high magnification, scale bar: 40µm. (C) Low magnification SEM images of bovine articular chondrocytes inside the scaffolds after 16 days of culture, scale bar: 200µm. (D) High magnification SEM images of chondrocytes inside the scaffolds after 16 days of culture. Scale bar: 50µm. (E) H&E staining of chondrocytes in AQ and HFIP silk scaffolds. Scale bar: 25µm. (F) Toluidine Blue staining in chondrocytes in AQ and HFIP scaffolds. Scale bar: 25µm. For C–F: Ctrl (no cytokine added), IL-1β (10ng/ml), and TNFα (10ng/ml).

