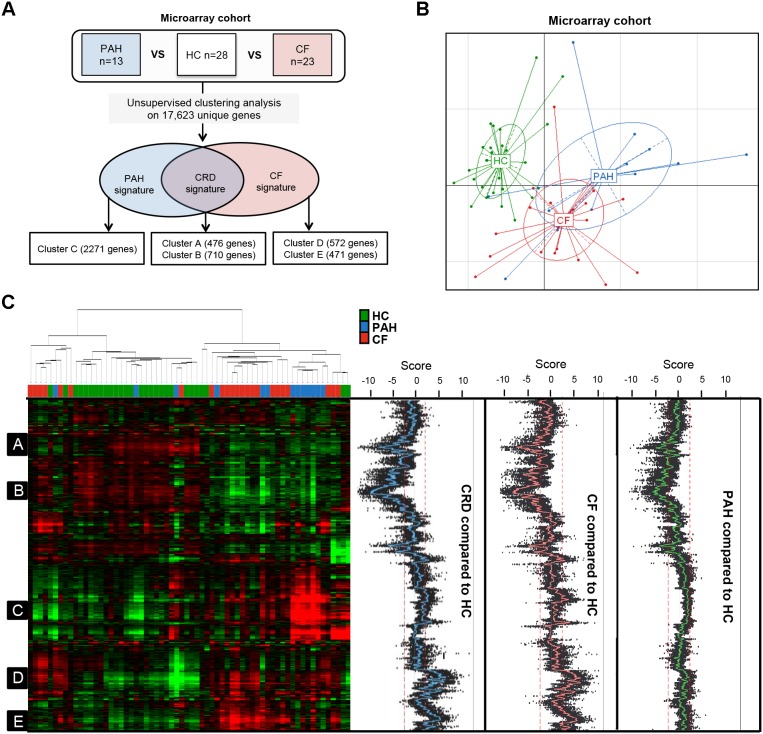
Figure 2. Unsupervised hierarchical clustering analysis.
A) Tree analysis. Clustering analysis based on the 30,146 probes corresponding to 17,163 unique genes expressed in PAH, CF patients and Healthy Controls (HC). 3 signatures were found: 1 common between CF and PAH (named CRD signature), 1 specific to CF and 1 to PAH; B) Principal Component Analysis (PCA) displayed a clear separation between HC and patients with CRD, whereas CF and PAH patients were less distinct; C) 5 groups of genes (or clusters) were selected, A to E, based on a combined approach: selected genes were clustered together and exhibited a t-test p-value below 1% between the CRD group (PAH+CF), CF or PAH versus HC. Green represents relatively low expression, and red indicates relatively high expression.

