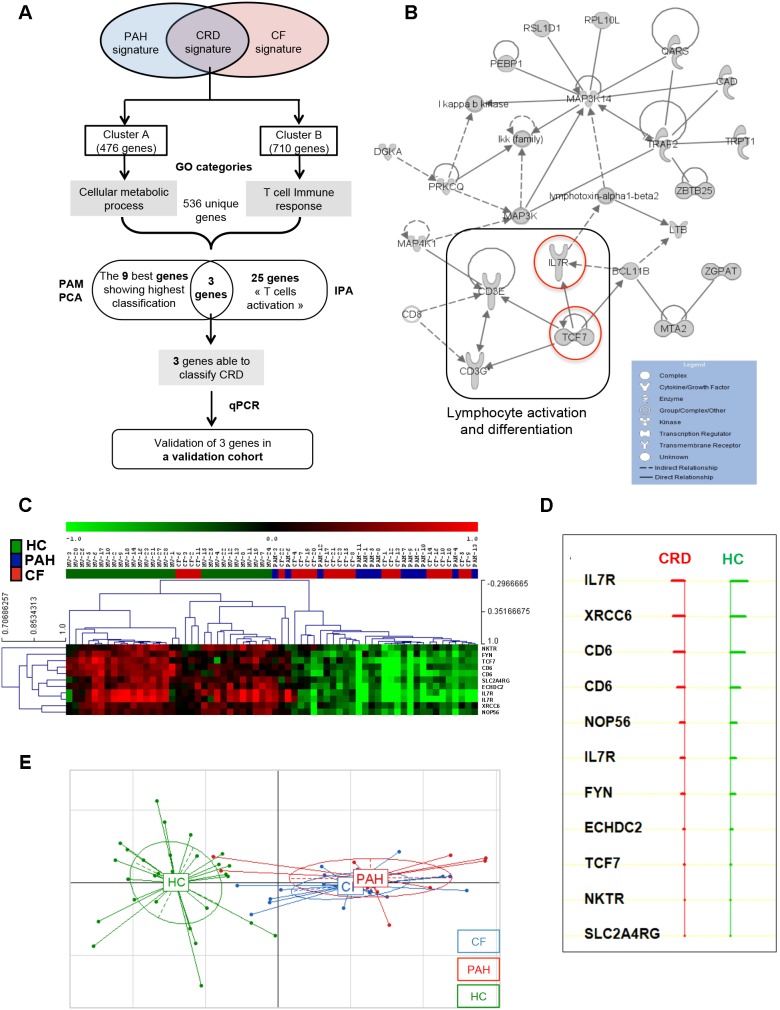
Figure 3. Characterization of under-expressed genes in the CRD signature.
A) Tree analysis of the CRD signature. Identification of the most representative genes by Gominer, PAM, IPA analysis and validation of the candidate genes in the validation cohort by qPCR; B) Network generated by IPA on the most significant GO categories in the CRD signature. Solid lines indicate direct interactions and dashed lines represent indirect interactions. Under-expressed genes in CRD are in gray. C) PAM analysis based on the most representative GO categories of Cluster A and B. Green represents relatively low expression, and red indicates relatively high expression. D) List of 9 genes able to classify correctly CRD and HC. E) The PCA graph of the 9 genes identified by PAM analysis indicated a clear separation between HC and patients with CRD (CF and PAH).

