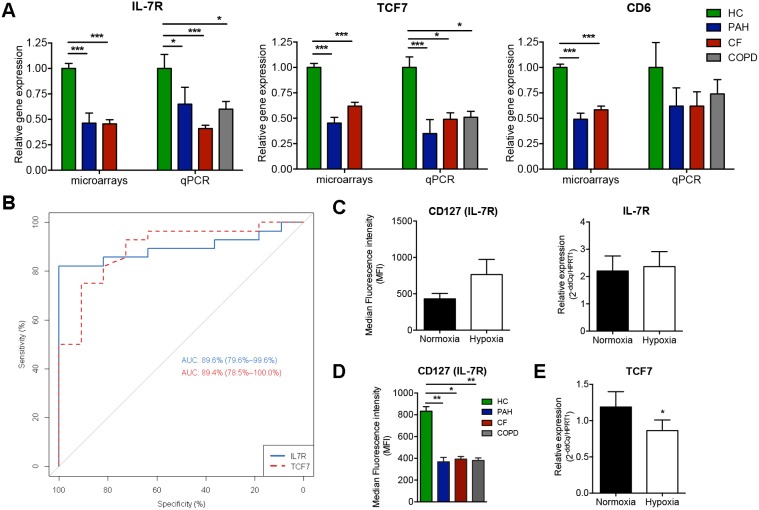
Figure 4. Validation of the most representative genes in the validation cohort.
A) Quantitative PCR validation of 3 genes from the PAM analysis (IL-7R, TCF-7 and CD6) using the validation cohort; B) based on these qPCR values, IL-7R and TCF-7 enabled good discrimination between patients with CRD and HC, according to a receiver operating characteristic (ROC) analysis (AUC = 89.6% with p<0.001 and AUC = 89.4% with p<0.001, respectively); C) Median intensity fluorescence (MFI) and mRNA expression of IL-7R in PBMCs from healthy controls (HC) cultivated 12 hours under hypoxic and normoxic condition; D) MFI of IL-7R on PBMCs from CRD patients compared to HC; E) TCF-7 expression in PBMCs from HC under hypoxia or normoxia.

