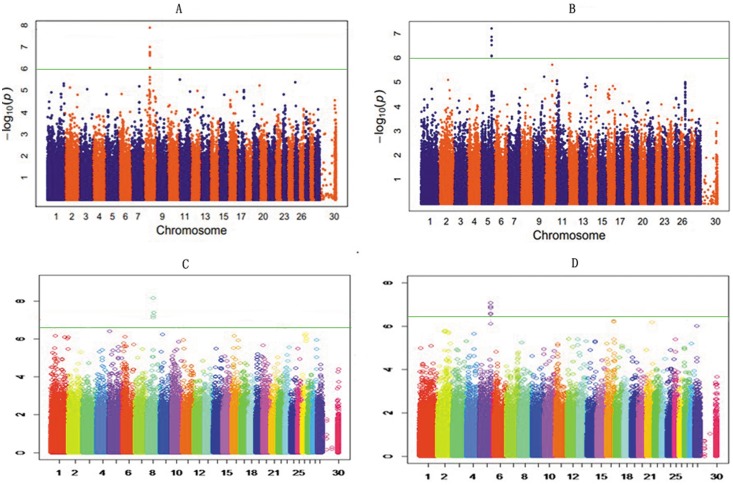
Figure 4. Manhattan plots of genome-wide association studies for two target traits.
A and B are the plots for foreshank weight and triglyceride levels in the single marker analysis, respectively. C and D are the plots for foreshank weight and triglyceride levels in the haplotype analysis, respectively. Chromosome 1–30 is shown separated by colors, and marker positions are indicated by the ticks on the horizontal axis. In each plot, the genome-wide significance level is shown as a horizontal reference line. The single marker results for both traits show several overlapping SNPs in each map, and this apparent overlap may easily lead to misunderstandings. These SNPs are actually located within close physical proximity, and the P values are nearly the same or even identical.

