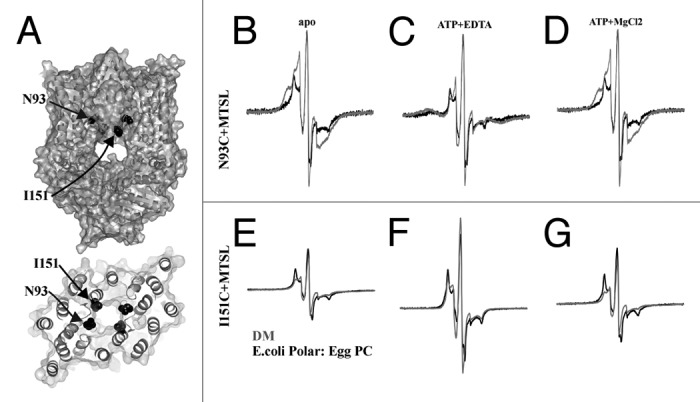
Figure 2. CW-EPR spectroscopy of MolBC_N93C+MTSL and I151C+MTSL showing the effect of lipid reconstitution on TMD conformation change. (A) Ribbon and space fill diagram of MolBC with N93 and I151 shown in black spheres. CW-EPR spectra of MolBC_N93C+MTSL (B-D) and I151C+MTSL (E-G) stabilized in E. coli polar lipid: Egg PC (3:1) liposomes or DM detergent micelles (black or gray respectively). Room temperature spectra (250 Gauss scan width) were recorded apo (B and E), ATP-bound (C and F), and post-hydrolysis (D and G). N93C spectra were normalized by the height of the central peak. I151C spectra were normalized for equal spin (normalized double integration values). MolBC surface and ribbon diagrams were prepared using PyMOL.47 Spectra were graphed using Grapher 9 (Golden Software Inc.).
