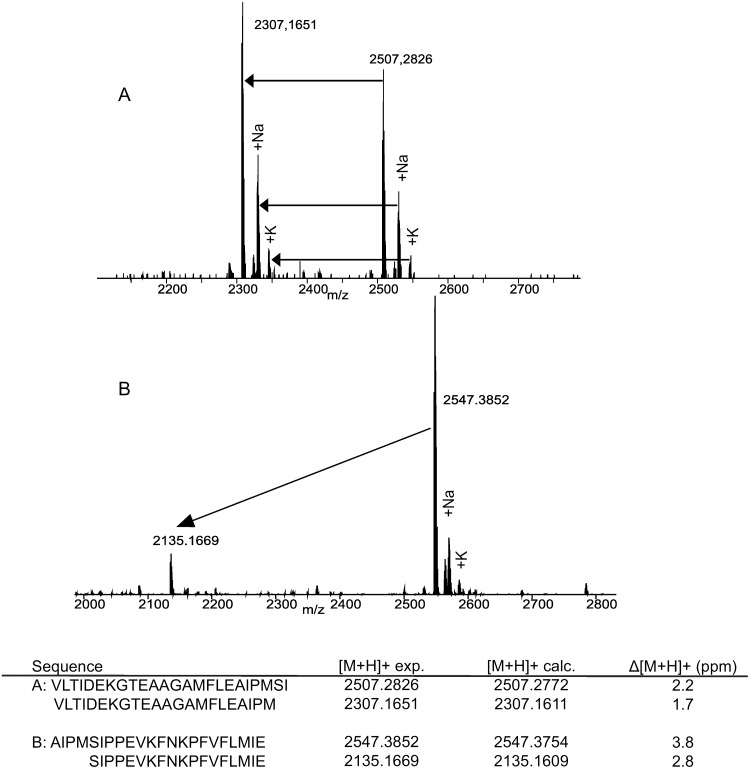
Figure 6. MALDI-MS spectra after incubation of A1AT peptides with HTRA1.
MALDI-Orbitrap-MS analysis as described in experimental procedures. A: Peptide A1AT(361–384) and generated fragment. Cleavage occurs after met381. B: Peptide A1AT(379–400) and generated fragment. Cleavage occurs again after met381. Further signals are sodium adduct (+22) and potassium adduct (+38). The image is representative of three independents experiments. The same incubation experiment was performed without addition of HTRA1 as negative control (Fig. S7).

