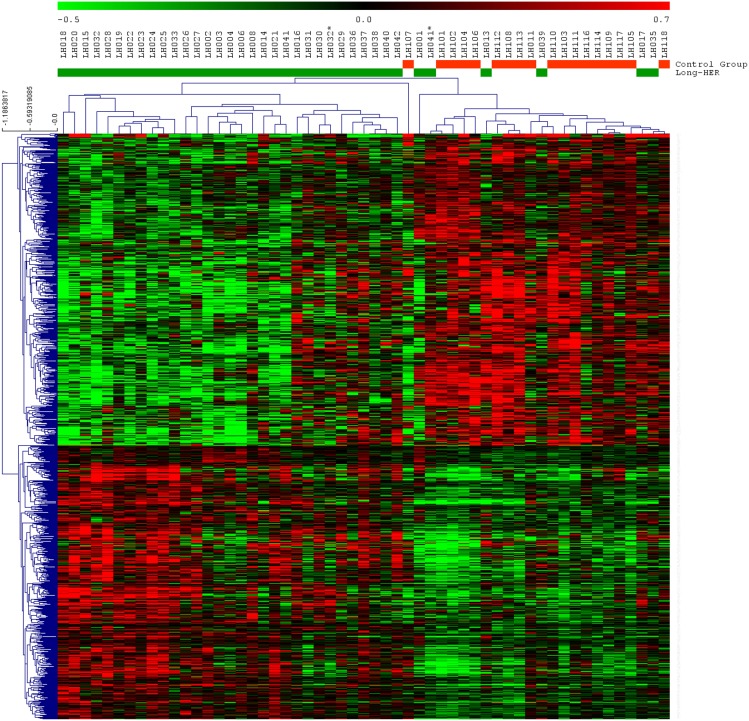
Figure 1. Supervised hierarchical clustering for all samples using 1052 differentially expressed probesets identified using SAM.
Each row represents a probeset and each column a sample. Green bars indicate samples from patients in Long-HER group, red bars indicate samples from short-term responders. There are two samples duplicated, * account for metastasis samples.

