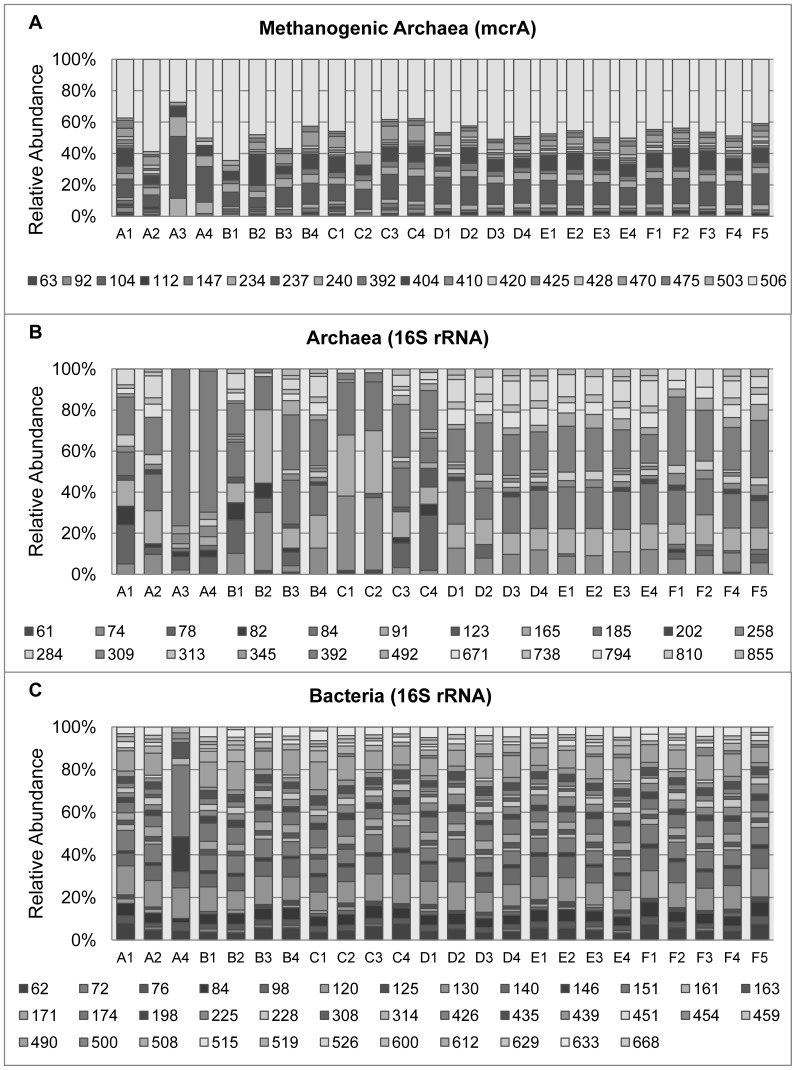
Figure 2. T-RFLP profiles of the three different genes studied in sediment inside the Lago Negro area.
A1-F5 represent the sampling points (see Figure 1 for more details), the bar size represents the relative abundance of each OTU, which are defined by their size in base pair (bp). (A) mcrA, (B) Archaeal 16S rRNA gene, and (C) Bacterial 16S rRNA gene.

