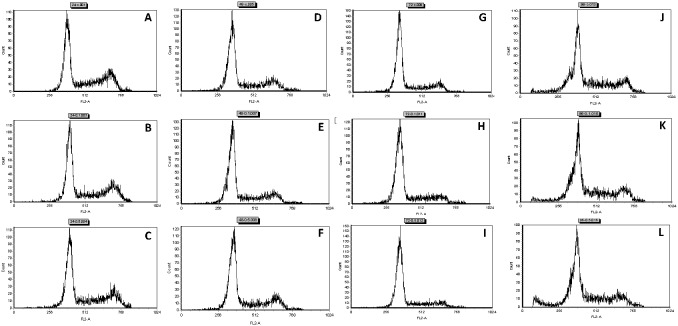
Figure 1. DNA Histograms demonstrating the attribution of HepG2 cells in cell cycle after sinigrin exposure for different periods of time.
A: sinigrin, 0 mM/24 h; B: 0.1 mM/24 h; C: 0.5 mM/24 h; D: 0 mM/48 h; E: 0.1 mM/48 h; F: 0.5 mM/48 h; G: 0 mM/72 h; H 0.1 mM/72 h; I: 0.5 mM/72 h; J: 0 mM/96 h; K 0.1 mM/96 h; L: 0.5 mM/96 h.

